New Relic's Complexity in Context video series is designed to give you a clear, hands-on understanding of how to use New Relic to cut through the complexity of distributed technologies in modern software environments. In this second episode, we’ll walk you through how to monitor Kubernetes with New Relic, so you can quickly troubleshoot and explore the different layers of your Kubernetes clusters.
To fully track and understand the performance of your Kubernetes environment, you have to rethink your monitoring strategies to account for new layers introduced in such complex, distributed environments. Among other things, you need to proactively monitor data and metadata for nodes, deployments, pods, containers, as well as frontend and backend applications and distributed traces, and hosts running in your Kubernetes clusters.

You can read through the steps here, and then watch the entire 4:47 video embedded at the end of the post.
Deploy the New Relic Infrastructure agent
To get started monitoring Kubernetes with New Relic, you'll need to deploy and configure the New Relic Infrastructure agent for your Kubernetes cluster. As of April 2019, we support Kubernetes 1.6 and higher, as well as managed services like Amazon Elastic Container Service for Kubernetes (EKS), Google Kubernetes Engine (GKE), Azure Kubernetes Service (AKS), and Openshift. Within minutes of deploying the agent, you'll have access to key metrics like container CPU usage, memory usage, container restarts, and a lot more.
(Follow the instructions in the New Relic user interface or refer our Kubernetes integration documentation for more information on installation and configuration.)
Operational views with the Kubernetes integration dashboard
Immediately after deploying the agent, you'll be able to access the Kubernetes integration dashboard:

In addition to giving visibility into operational data like number of resources used, name spaces per cluster, name spaces per pod, and container restarts, the dashboard displays the relationship between objects in the cluster:

The default dashboard is a good starting point for monitoring your cluster, but to understand what’s really happening in your cluster, you'll want to delve deeper using the Kubernetes cluster explorer.
Troubleshoot with the Kubernetes cluster explorer
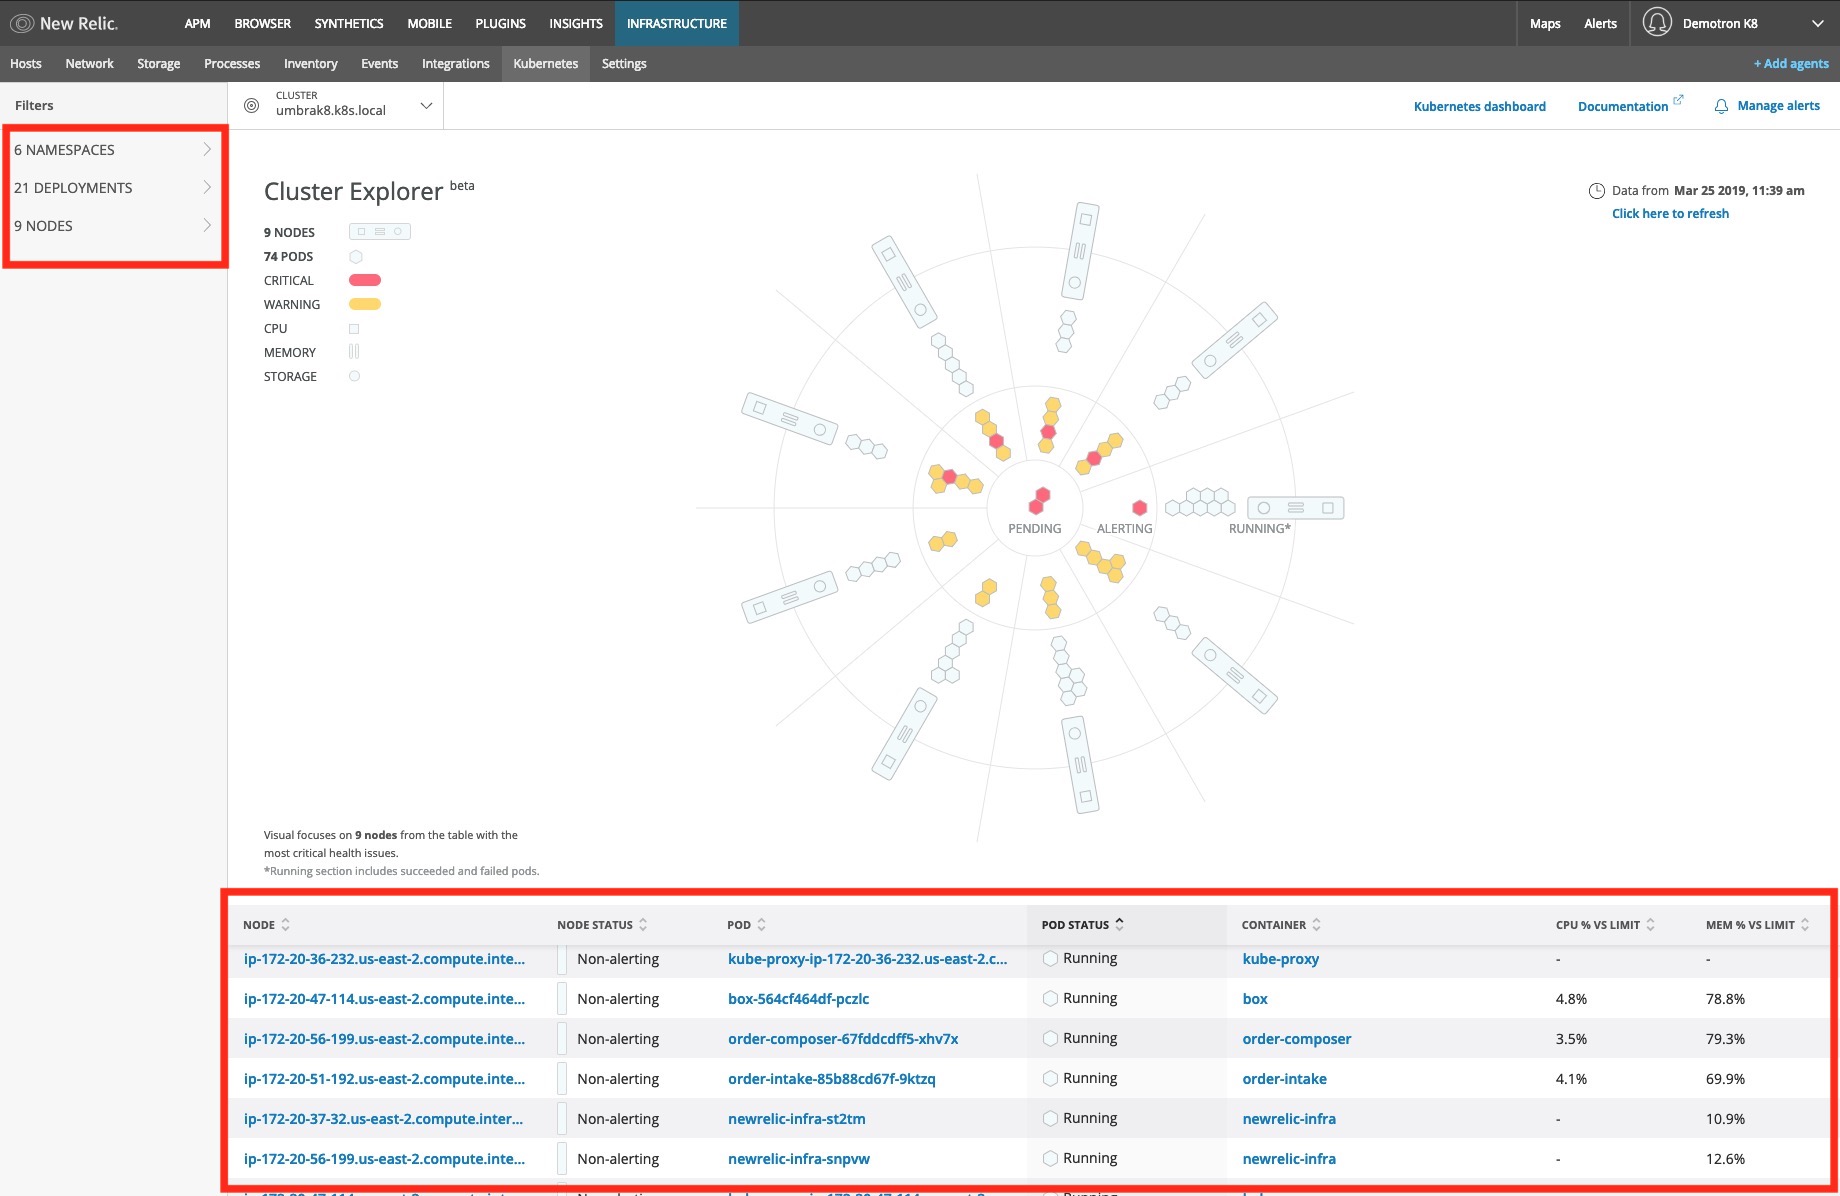
With the cluster explorer, you can observe performance and dependencies across your entire Kubernetes environment. This sample of the default view shows a cluster of nine nodes with concentric circles:

Each circle in the explorer represents an area of interest. The outer ring shows nodes in the cluster. Each node representation has an indicator for CPU and memory usage and storage. As you move inward, hexagons represent the distribution and status of pods associated with a selected node. For example, if a pod is red, an alerting threshold has been breached; even if it’s running, the pod likely has a health issue. Finally, pods in the center require critical attention; these pods either aren’t running or Kubernetes is unable to schedule them.
Click into a pod to access detailed information about any dependencies in the pod, as well as to view specific performance metrics for the containers and applications running in the pod.
In the example shown below, the pod details show the pod is pending, and the container is waiting, due to an invalid image name:

Finally, use the cluster explorer’s advanced filtering to divide and view your cluster in multiple ways. Select the namespaces, deployments, or labels you care about for a more accurate view—based on what's important to you and your role. You can also view a complete list of all nodes, pods, and containers in a cluster, and filter the list by status as you troubleshoot.
Monitor performance metrics from apps hosted in Kubernetes
From within the Kubernetes cluster explorer, you can also see important details about any applications your cluster is hosting, including access to metrics that track response time, throughput, error rate, and violations. Any pods running an application instrumented with New Relic APM will have links in the pod details pane to the APM overview page and the distributed tracing page.

These links help you correlate your infrastructure and applications, so you can troubleshoot issues regardless of which side you approach the problem from.
Watch the video and get started
With the Kubernetes integration and cluster explorer, New Relic provides a proactive approach to monitoring your Kubernetes environment. The integration is available to all New Relic Infrastructure customers at the Pro level.
Additional Resources:

The views expressed on this blog are those of the author and do not necessarily reflect the views of New Relic. Any solutions offered by the author are environment-specific and not part of the commercial solutions or support offered by New Relic. Please join us exclusively at the Explorers Hub (discuss.newrelic.com) for questions and support related to this blog post. This blog may contain links to content on third-party sites. By providing such links, New Relic does not adopt, guarantee, approve or endorse the information, views or products available on such sites.


