In my blog on Absolutely simple network monitoring, I described how to monitor a single network device. Now let's up the ante: monitoring three (or more) network devices.
For this post, I’m going to assume you have three networking devices (routers, in my example). I’ll show you how to set up those routers in a simple network configuration and monitor them with New Relic.
Here’s an overview of what I’ll cover:
1. Setting up your network devices.
2. Downloading and installing all required software.
3. Setting up the New Relic virtual machine (VM).
4. Testing your network.
If you’re a networking guru and can set up a hybrid OSFP-BGP-EIGRP-RIP network before your morning coffee, you can skip ahead to the New Relic part. And if you’re a veteran New Relic expert who has instrumented so many entities that you have the dashboards, quickstarts, and NRQL queries memorized, you can probably stop reading and just go with your gut once you get the network piece installed.
Getting started
If you don’t have Linux and Docker set up, follow the setup instructions from this blog.
Your devices need to be able to connect to each other via a protocol like ping, ssh, or rdp, and they also need to connect to the machine running the New Relic agent. For that reason, you’ll probably need a switch that connects your routers with the machine running the New Relic agent on one network.
Setting up your network
This example shows the setup for three routers communicating with each other using the EIGRP routing protocol. Each router also connects to a common switch, which is connected to the rest of your network and hopefully the internet.
Every router is different, so your router setup will vary. You do need to make sure each router is connected to the switch using the appropriate ethernet (whether regular, fast ethernet, or gig-e) port. Each of the routers needs to be connected to the other two, so if you were to lay them out, they would make a triangle with each router a vertex of the triangle.
Here’s a visual of how the network looks.
I’ve named my routers Spring, Summer, and Fall. Before diving into the configuration, here’s the networking scheme:
Router1: Spring
- Interface s0/0 (serial) connects to interface s0/0 on Summer using the network 10.1.1.1/24 (/24 means the gateway is 255.255.255.0).
- Interface s0/1 (serial) connects to interface s0/0 on Fall using network 10.1.3.2/24.
- Interface f2/0 (FastEthernet) connects e1 of Switch 1 and gets an IP address from whatever is handing them out on your home network (such as via DHCP).
Router2: Summer
- Interface s0/0 connects to s0/0 on Spring using network 10.1.1.2/24.
- Interface s0/1 connects to s0/1 on Fall using network 10.1.2.1/24.
- Interface f2/0 (FastEthernet) connects e2 of Switch 1 and gets its IP via DHCP.
Router3: Fall
- Interface s0/0 connects to s0/1 on Summer using network 10.1.2.2/24.
- Interface s0/1 connects to s0/1 on Spring using network 10.1.2.2/24.
- Interface f2/0 (FastEthernet) connects e3 of Switch 1 and gets its IP via DHCP.
The spring router should be connected to your PC via a console cable. On your PC, open up PuTTY (or a similar telnet/ssh tool) and hit enter until you see the configuration prompt.
Enter the following commands for the Spring router to set up the serial interface, the fast ethernet interface, and EIGRP routing. It’s up to you whether you want to type the commands in yourself, line by line, or copy-paste them into your terminal. I’ve left spacing between each section for readability:
conf t
hostname Spring
snmp-server community nr1gns3 ro
int s0/0
ip addr 10.1.1.1 255.255.255.0
no shut
exit

int s0/1
ip addr 10.1.3.2 255.255.255.0
no shut
exit

int fa2/0
ip addr dhcp
no shut
exit
You still have a few commands to go, but first, make note of the IP address of the ethernet interface. You should see a console message that looks like this:
Write down the IP address and the subnet mask. In the example above, it would be 192.168.122.115, and a mask of 255.255.255.0.
Finally, to set up the router network, enter the last few commands:
router EIGRP 1
network 10.1.1.0 0.0.0.255
network 10.1.3.0 0.0.0.255

end
wr mem
Next, you need to configure the other two routers. You’ll notice that these sets of commands are almost identical, except for the hostname and IP address ranges. That said, make sure you enter those differences correctly, or your network isn’t going to work. Don’t forget to note each router’s ethernet interface IP address as well.
Summer:
conf t
hostname Summer
snmp-server community nr1gns3 ro
int s0/0
ip addr 10.1.1.2 255.255.255.0
no shut
exit

int s0/1
ip addr 10.1.2.1 255.255.255.0
no shut
exit

int fa2/0
ip addr dhcp
no shut
exit

router EIGRP 1
network 10.1.1.0 0.0.0.255
network 10.1.2.0 0.0.0.255

end
wr mem
Fall:
conf t
hostname Fall
snmp-server community nr1gns3 ro
int s0/0
ip addr 10.1.3.1 255.255.255.0
no shut
exit

int s0/1
ip addr 10.1.2.2 255.255.255.0
no shut
exit

int fa2/0
ip addr dhcp
no shut
exit

router EIGRP 1
network 10.1.3.0 0.0.0.255
network 10.1.2.0 0.0.0.255

end
wr mem
Check to ensure your network is working by issuing the following commands on all three routers:
ping 10.1.1.1
ping 10.1.1.2
ping 10.1.2.1
ping 10.1.2.2
ping 10.1.3.1
ping 10.1.3.2
You should see a response like this:
If you receive failure messages, you’ll need to review your configuration.
Setting up New Relic
I covered most of this in part one of this blog series. Install Linux on a machine or VM, install OpenSSH and Docker, and make sure you have a New Relic account.
Next, you need to set up the network performance monitoring agent. Log in and select Add More Data from the left-hand pane.
In the search bar, type network and then select SNMP from the Network Performance Monitoring section.
Choose your account and set the SNMP version. If you don’t know the version, select v2c. Leave the polling interval as is unless you have a reason to change it.
Set your CIDR range to your network range, which, if you’re following along with my example, would be 192.168.122.0/24. Enter your SNMP community string. Then select Validate and continue.
You’ll see a command that will do an initial discovery of your network devices. Next, you need to run some fairly complex commands on the <NR1-agent> VM, so you should SSH into your machine using a utility that supports copy and paste such as PuTTY or Linux terminal.
Copy the command from New Relic and paste it into the <NR1-agent> terminal.
If everything goes well, you’ll see a line near the bottom that says Ktranslate Adding 3 new SNMP devices.
Next, go back to New Relic and select Continue. You’ll receive another command to copy and paste into your SSH session.
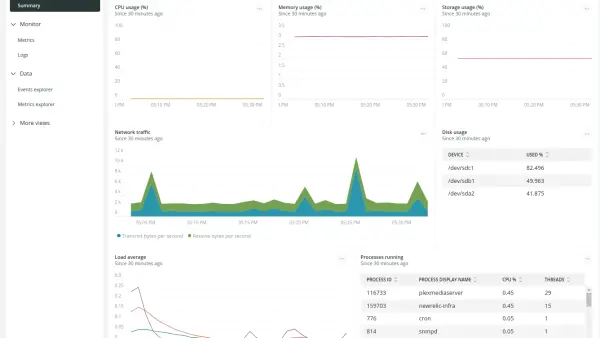
At this point, if everything went well, New Relic will be monitoring your devices and your Routers dashboard in New Relic might look something like this. Note that it might take a minute (or fifteen) for data to show up. That delay is completely normal.
This particular dashboard gives you high-level information you’d expect to see for a router, from CPU and RAM to individual interface stats. But there are several other screens and dashboards (and even auto-generated maps) that—depending on the types of devices you’ve added and their configuration—will be available.
But regardless of what you see initially, I want to point out that you’re now using New Relic to monitor a network device! Give yourself a high five!
Next steps
Start monitoring your network devices today with New Relic. If you’re not already using New Relic, get started with New Relic for free. Your free account includes 100 GB/month of free data ingest, one free full-access user, and unlimited free basic users.
Join our New Relic Slack community to continue the conversation with hundreds of other developers using New Relic.

The views expressed on this blog are those of the author and do not necessarily reflect the views of New Relic. Any solutions offered by the author are environment-specific and not part of the commercial solutions or support offered by New Relic. Please join us exclusively at the Explorers Hub (support.newrelic.com) for questions and support related to this blog post. This blog may contain links to content on third-party sites. By providing such links, New Relic does not adopt, guarantee, approve or endorse the information, views or products available on such sites.