Media giant Gannett’s infrastructure runs on containers and is orchestrated by Kubernetes. However, when the team there looks at their clusters, they need to know much more than “is Kubernetes up or down?”
At companies like Gannett, infrastructure utilization and deployment speed are driving Kubernetes adoption at a rapid pace, but because orchestration automation means less control and visibility, teams can quickly lose track of what’s happening in their clusters. They can run into issues like:
- Automatic scheduling of pods can cause capacity issues if they’re not monitoring resource availability.
- Containers can crash if they haven’t allotted them enough memory.
- The Kubernetes API could stop responding if it receives too many requests.
Without the proper monitoring in place, these kinds of issues can make it difficult to run Kubernetes in production.
New Relic is changing that.
Today, we introduce the New Relic Infrastructure on-host integration for Kubernetes, providing deep monitoring of the container orchestration layer. This integration collects metrics that monitor data and metadata for nodes, Namespaces, Deployments, ReplicaSets, Pods, and containers, so you can fully monitor your frontend and backend applications and hosts running in your Kubernetes clusters. Expect total visibility, alerting, and dashboards for all Kubernetes entities that live in between your applications.
See into your containerized infrastructure
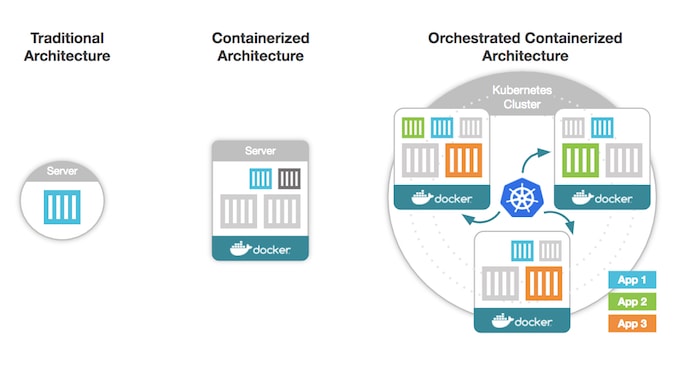
In a traditional software architecture, teams had an application and a server. As teams realized they needed to move faster and deploy more applications at scale, they adopted containerized applications and changed the relationship between the application and its infrastructure. Now with Kubernetes, teams have added another layer, and the number of relationships and entities that need to be instrumented has gone up an order of magnitude.
Running Kubernetes requires teams to rethink and adapt their monitoring strategies to take into account all of the new layers introduced in a distributed Kubernetes environment. Here are the key layers you need to monitor in a Kubernetes environment:
- User experience: Track and monitor mobile application and browser performance to gain insight into things like response time and errors. It’s also imperative to monitor load time and availability to ensure customer satisfaction.
- Applications: Monitor the performance and availability of applications running inside your Kubernetes cluster. Measure things like request rate, throughput, and error rate.
- Containers: Monitor CPU and memory consumption and how close it is from the limits you’ve configured. Check for containers that can’t start because they are stuck in a “crash loop backoff.”
- Deployments/Pods: Ensure all desired pods in a deployment are running and healthy.
- Nodes: Monitor the CPU, memory, and disk utilization for Kubernetes workers and masters to ensure all nodes are healthy.
- Cluster: Track the capacity and resource utilization of your cluster.
A new approach to monitoring Kubernetes
The New Relic Kubernetes integration brings in system-level metrics so you can quickly view, troubleshoot, and alert on the most important parts of your cluster. Out of the box, New Relic provides a snapshot so you can quickly view all of the entities in your cluster:
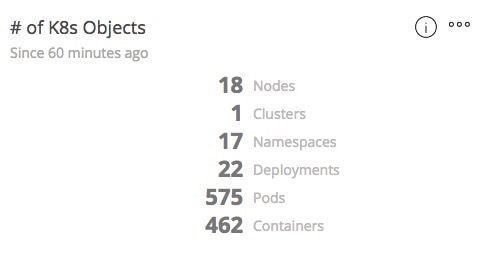
In addition to giving visibility into operational data like number of resources used and Namespaces per Cluster and per Pod, the dashboard also lets you see the relationships between objects in the cluster while also letting you take advantage of the labeling system built into Kubernetes.
As a starting point, the following dashboard surfaces the most important metrics for immediate insight into the important metrics in your Kubernetes environment.

Additionally, you can create your own custom Kubernetes dashboards in New Relic Insights. For example, add metrics from your containerized applications and correlate them with your customer experience metrics.
Correlation to applications
With New Relic, you can move from an infrastructure-centric view to an application-centric one. Combining application metrics and Kubernetes metrics to view cluster data gives you a deeper understanding of the application performance in your cluster.
While the on-host integration gives an infrastructure-centric view of Kubernetes, with New Relic APM you can quickly move out of the cluster and into the application to better understand how it’s running and gain insights into metrics like error rate and transaction time.

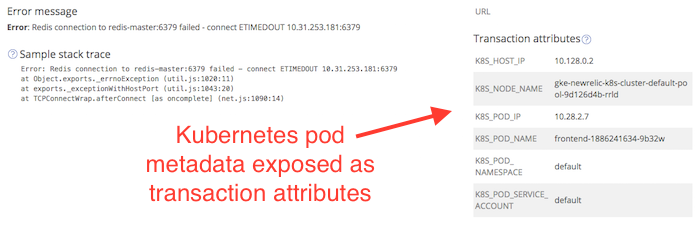
From here, you can navigate to the transactions page where, with a bit of custom instrumentation using the Kubernetes Downward API, you can drill into any error details you need to investigate. The transaction attributes shows you, among other details, the Kubernetes hostname and IP address where the error occurred:
You can also see useful information about performance outliers and track down individual errors. For instance, using APM Error Profiles, you can see that nearly 57% of errors come from the same Pods and Pod IP addresses:
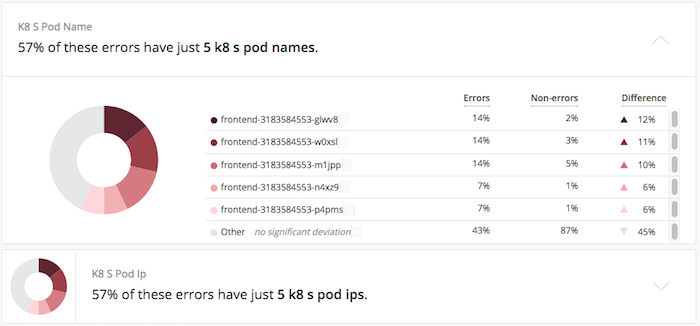
APM Error Profiles automatically incorporates the custom parameters and uses different statistical measures to determine if an unusual number of errors is coming from a certain Pod, IP, or host within the container cluster. From there, you can zero in on infrastructure or cluster-specific root causes of the errors (or maybe you’ll just discover some bad code).
For teams running applications at scale with Kubernetes, this ability to troubleshoot from the infrastructure to the application level is critical. Investigations that may have once taken hours may now take just a few minutes.
Set alerts that matter
Use this integration to create custom alert conditions for your Kubernetes data such as:
- Alert on actual vs. limit CPU and memory for containers
- Alert on actual vs. desired Pod replicas
- Alert on Kubernetes components that are down (via process alerting)
- Alert on any query you write about your Kubernetes data
Start monitoring Kubernetes in New Relic
Learn how to get started with the Kubernetes on-host integration in the documentation.
The Kubernetes integration is available in public beta to all New Relic Infrastructure customers paying at the Pro level. Additionally, the integration can be used by customers running Kubernetes on Amazon Web Services (AWS), Microsoft Azure, Google Cloud Platform, and IBM Cloud Container Service.
Read how IBM Cloud Container Service simplified Kubernetes management with New Relic.

The views expressed on this blog are those of the author and do not necessarily reflect the views of New Relic. Any solutions offered by the author are environment-specific and not part of the commercial solutions or support offered by New Relic. Please join us exclusively at the Explorers Hub (discuss.newrelic.com) for questions and support related to this blog post. This blog may contain links to content on third-party sites. By providing such links, New Relic does not adopt, guarantee, approve or endorse the information, views or products available on such sites.


