Nonfunctional requirements (NFRs) in software engineering are often overlooked by developers. Despite this, they are indicators of good applications and are vital to the success of a system. Failing to meet NFRs can create systems that do not meet the needs of the business, customers, market, or applicable regulations or standards.
There are many aspects to achieving types of NFRs, and one of them is observability. Observability creates a proactive approach to troubleshooting and optimizes software systems effectively. One common example is if there are system errors, developers can quickly find the root cause and fix them. This blog provides a walkthrough of utilizing source maps with New Relic browser functionality for a better debugging experience.
New Relic for web application
Before implementing New Relic for our web applications, we had already utilized New Relic for backend applications. New Relic offers numerous useful features for web applications, primarily focusing on performance and error monitoring. This documentation can be viewed for a comprehensive overview of all New Relic browser features.
Setup
According to New Relic documentation, there are two ways to install New Relic in web applications. The first method is installation on the web server, which is recommended for a non-Single Page Application (SPA). The second method requires adding a JavaScript snippet to the HTML file, and is recommended for SPA. Since our application is SPA, we chose the second approach to installation.
For background, we at Halodoc use Google Tag Manager (GTM) to manage third-party tools. In this case, rather than manually adding the JavaScript snippet to the HTML file, we configured the New Relic installation in our GTM dashboard. This approach simplifies the installation process by eliminating any changes to the source code.
Before proceeding with the New Relic installation, the initial step required is to add browser application data to the New Relic dashboard. This is crucial for generating application data, including the Application ID, which is required during installation. Once this step is complete, the next step involves adding the following JavaScript snippet in GTM tags:
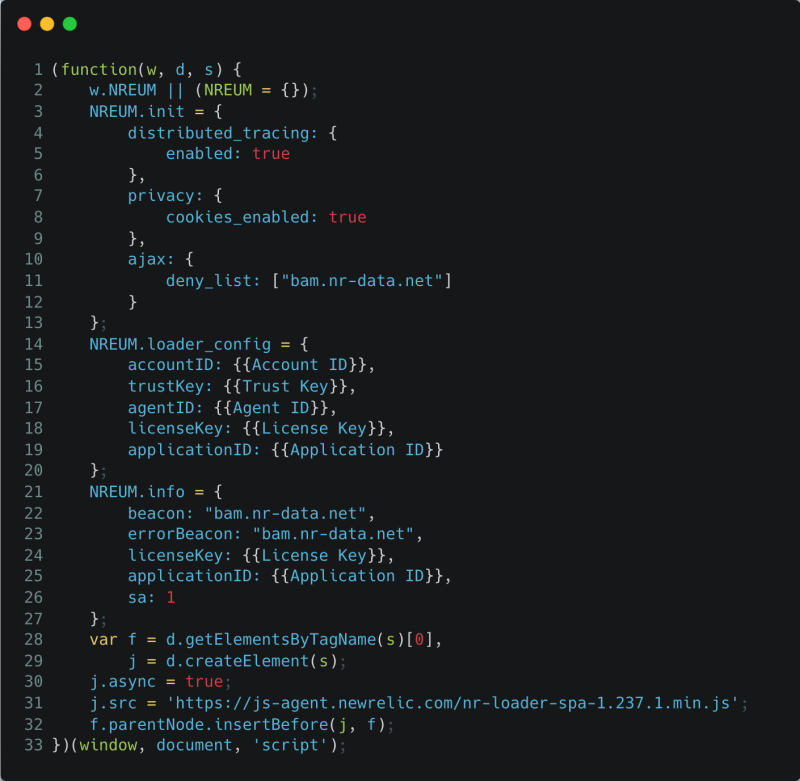
After publishing the GTM tag, the New Relic script will be loaded along with the GTM script loaded by the user on our web page, initiating the capturing of events.
Note: A potential challenge that may arise is a Content Security Policy (CSP) issue. In our case, it is necessary to add https://bam.nr-data.net to the connect-src directive in CSP. For additional information on this matter, please refer to New Relic CSP guideline.
One of the notable features of New Relic is its support for single-page application (SPA) monitoring. New Relic monitoring doesn't cease immediately after the Windows load event is fired; instead, it continues to monitor virtually anything that executes inside the browser. This includes route changes, all subsequent JavaScript, and all AJAX events. Consequently, New Relic captures detailed information about the initial page load performance, route changes, historical performance, and error monitoring.
Monitor JavaScript errors
Once New Relic is installed in a web application, it starts identifying errors caught by the user, as below:

Hmm, it looks like the error isn't very informative, huh? While we may know the error, determining where exactly the error occurred is still challenging. This makes it quite difficult for developers to resolve these errors. So why does this happen? Why is the original file not displayed? Let me explain…
Build process of modern web development
In traditional web development, we create web applications using pure HTML, CSS, and JavaScript, deploying the same files to the server. However, with the complexity of modern web applications, web development workflows often involve various frameworks and tools. These tools require a build process to convert your code into standard HTML, JavaScript, and CSS that browsers can understand. Additionally, a common practice for performance optimization is to compress files—using tools like UglifyJS to minify and chunk JavaScript—and combine them. This not only reduces the size but also increases the efficiency of the web deployment.
For example, using build tools, we can transpile and compress the following TypeScript file into a single line of JavaScript.

Code example
A minified version would be:

Minified Version
However, these optimizations can pose challenges in debugging. Compressed code with everything on one line and shorter variable names can make it difficult to determine the source of the error. This is where source maps come in—they map your compiled code back to the original code, making debugging easier.
Source maps to improve debugging experience
Most build tools, such as Vite, webpack, esbuild, and many others, can generate source map files during the build process. These files have names ending in .map (for example, main.js.map and style.css.map). Source map files contain essential information about how the compiled code matches the original code, facilitating easy debugging for developers. The following is an example of a source map.

Example of source map file
The most important aspect of the source map is the mappings field, which uses encoded strings to map lines and locations in the compiled file to corresponding locations in the original file.
Note: You can refer to the source map specification for a deeper understanding of source map files.
Unfortunately, in a production environment, disabling source maps is recommended to enhance security and reduce payload size. This makes achieving a better debugging experience for the production environment more challenging. That's why we need to find a way to address our problem. Keep going!
Updating the production deployment process for enhanced debugging
In our previous implementation process, illustrated in the diagram below, in essence, the application is built with source maps disabled, and the resulting artifacts are deployed to the server.

Previous simplified deployment process
To improve debugging capabilities and develop a more effective troubleshooting environment, we introduced an updated implementation process as depicted in the following diagram:

Updated simplified deployment process
Updated deployment process:
- Enable source map for production build: To begin the enhanced debugging journey, the first step involves enabling source maps during a production build. This allows us to preserve important information about the original source code, providing a foundation for comprehensive debugging.
- Upload source map files to New Relic: Next, we leverage New Relic capabilities by uploading the resulting source map file. By doing this, we seamlessly integrated New Relic into our debugging workflow, allowing it to map compiled code back to its original source. Please refer to this documentation on uploading source maps to New Relic.
- Remove source map files from production artifacts: With the source maps safely stored in New Relic, we removed them from our production artifacts. This optimizes payload size and aligns with best practices for securing production environments.
- Deploying optimized artifacts to server: Finally, armed with optimized and secure artifacts, we deploy them to the server. The absence of source maps from production artifacts does not hinder our debugging efforts. Instead, New Relic continues to provide valuable insights for effective problem-solving.
This updated deployment process ensures a harmonious balance between optimized production performance and an enriched debugging experience. This reflects our commitment to delivering web applications that are robust and easy to maintain.
The improved debugging experience
The results were incredible after applying the updated deployment process to our production environment. The image below represents what we now observe when an error occurs in our application.

New Relic stack trace with source map
The image above clearly shows how New Relic errors inbox has revolutionized the debugging process. It identifies the errors occurrence and provides detailed information about the specific lines of code and files involved. These details are essential in speeding up the debugging process in a production environment. Thus, our developers can quickly and precisely solve problems that arise
New Relic event trail to replicate the error
One of the important rules for software engineers when troubleshooting errors is the need to replicate the error before attempting to fix it. This step is critical to ensure that any corrective action addresses the root cause of the issue. However, it is often difficult to replicate the issue, even when following the same steps as the user who encountered the error.
New Relic event trail exists to assist developers in identifying how to replicate errors, as illustrated in the following image:

New Relic event trail
The image shows how easily we can gather important information about an error occurring. Timelines provide insight into when a user encountered an error, explaining the sequence of events leading up to the error. In this example, the error occurs when the user clicks the "Berikutnya" button in the URL www.halodoc.com/obat-dan-vitamin/checkout/payment.
Additionally, this provides valuable information for problem identification, such as the device used, operating system, software version, and even the user's location when encountering the error. With this comprehensive data, we can easily replicate errors experienced by users, thereby speeding up the error remediation process. This comprehensive approach ensures faster and more accurate resolution of software glitches.
Conclusion
The integration of source maps and New Relic has helped us to improve the web debugging experience. As a result, New Relic's detailed error reporting allows developers to fix the errors appropriately. New Relic event trail has also simplified the error replication process, significantly impacting our troubleshooting capabilities.
On average, leveraging these tools can reduce error resolution times from hours to minutes. This not only speeds up issue resolution but also contributes to the overall reliability of our web applications.
This blog post originally appeared on the Halodoc website.
The views expressed on this blog are those of the author and do not necessarily reflect the views of New Relic. Any solutions offered by the author are environment-specific and not part of the commercial solutions or support offered by New Relic. Please join us exclusively at the Explorers Hub (support.newrelic.com) for questions and support related to this blog post. This blog may contain links to content on third-party sites. By providing such links, New Relic does not adopt, guarantee, approve or endorse the information, views or products available on such sites.


