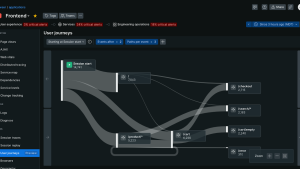
In order to improve uptime and maintain high levels of service reliability, teams need the ability to detect incidents faster, isolate the causes, and remedy the problems quickly.
To better equip reliability teams, we’re excited to announce that results from all synthetic monitor types are now available in New Relic One.
Adding results from synthetic monitors into New Relic One helps users more easily troubleshoot incidents by connecting data from customer-facing endpoints to the underlying health of backend services and infrastructure, with a UI that provides more immediate context into availability, functionality, and performance. By having everything in one centralized location, plus the immediate context of full-stack health, reliability teams now have a more instantly streamlined path to incident remediation.
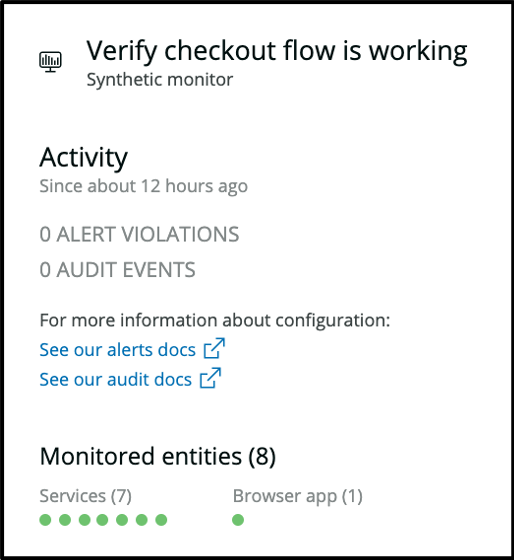
What’s new?
We recently relaunched the Synthetics customer experience to provide quicker context to help troubleshoot issues across uptime, functionality, and performance. Now, all Synthetics monitors leverage the new UI and entity search, health banner, location health, default charts, and application health status.
Here’s a quick tour of the monitors and the results you can expect to see below:
For basic uptime
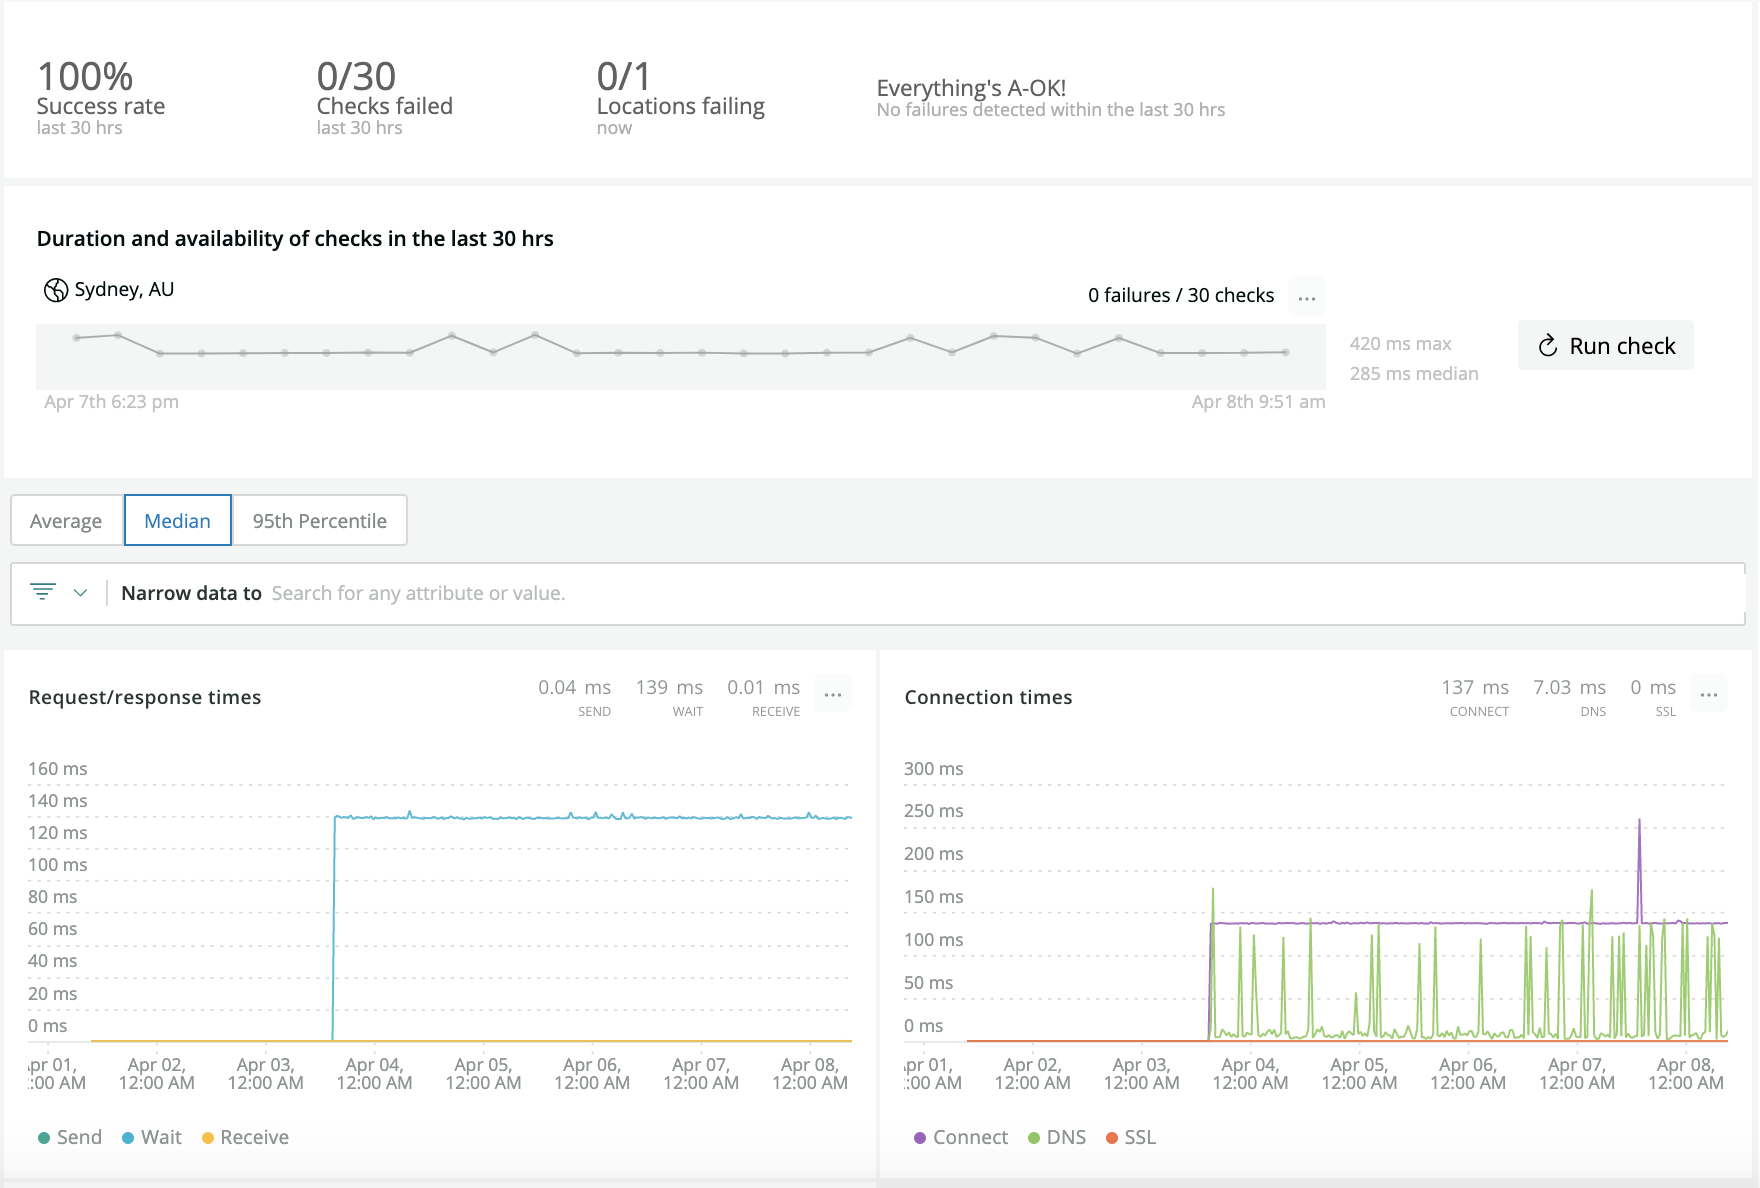
The ping monitor sends a GETHEAD request to a URL, and returns information from the header of that URL. The ping monitor is the easiest way to ensure that you’re proactively measuring the availability of critical URLs and APIs.
For uptime and performance of a single URL
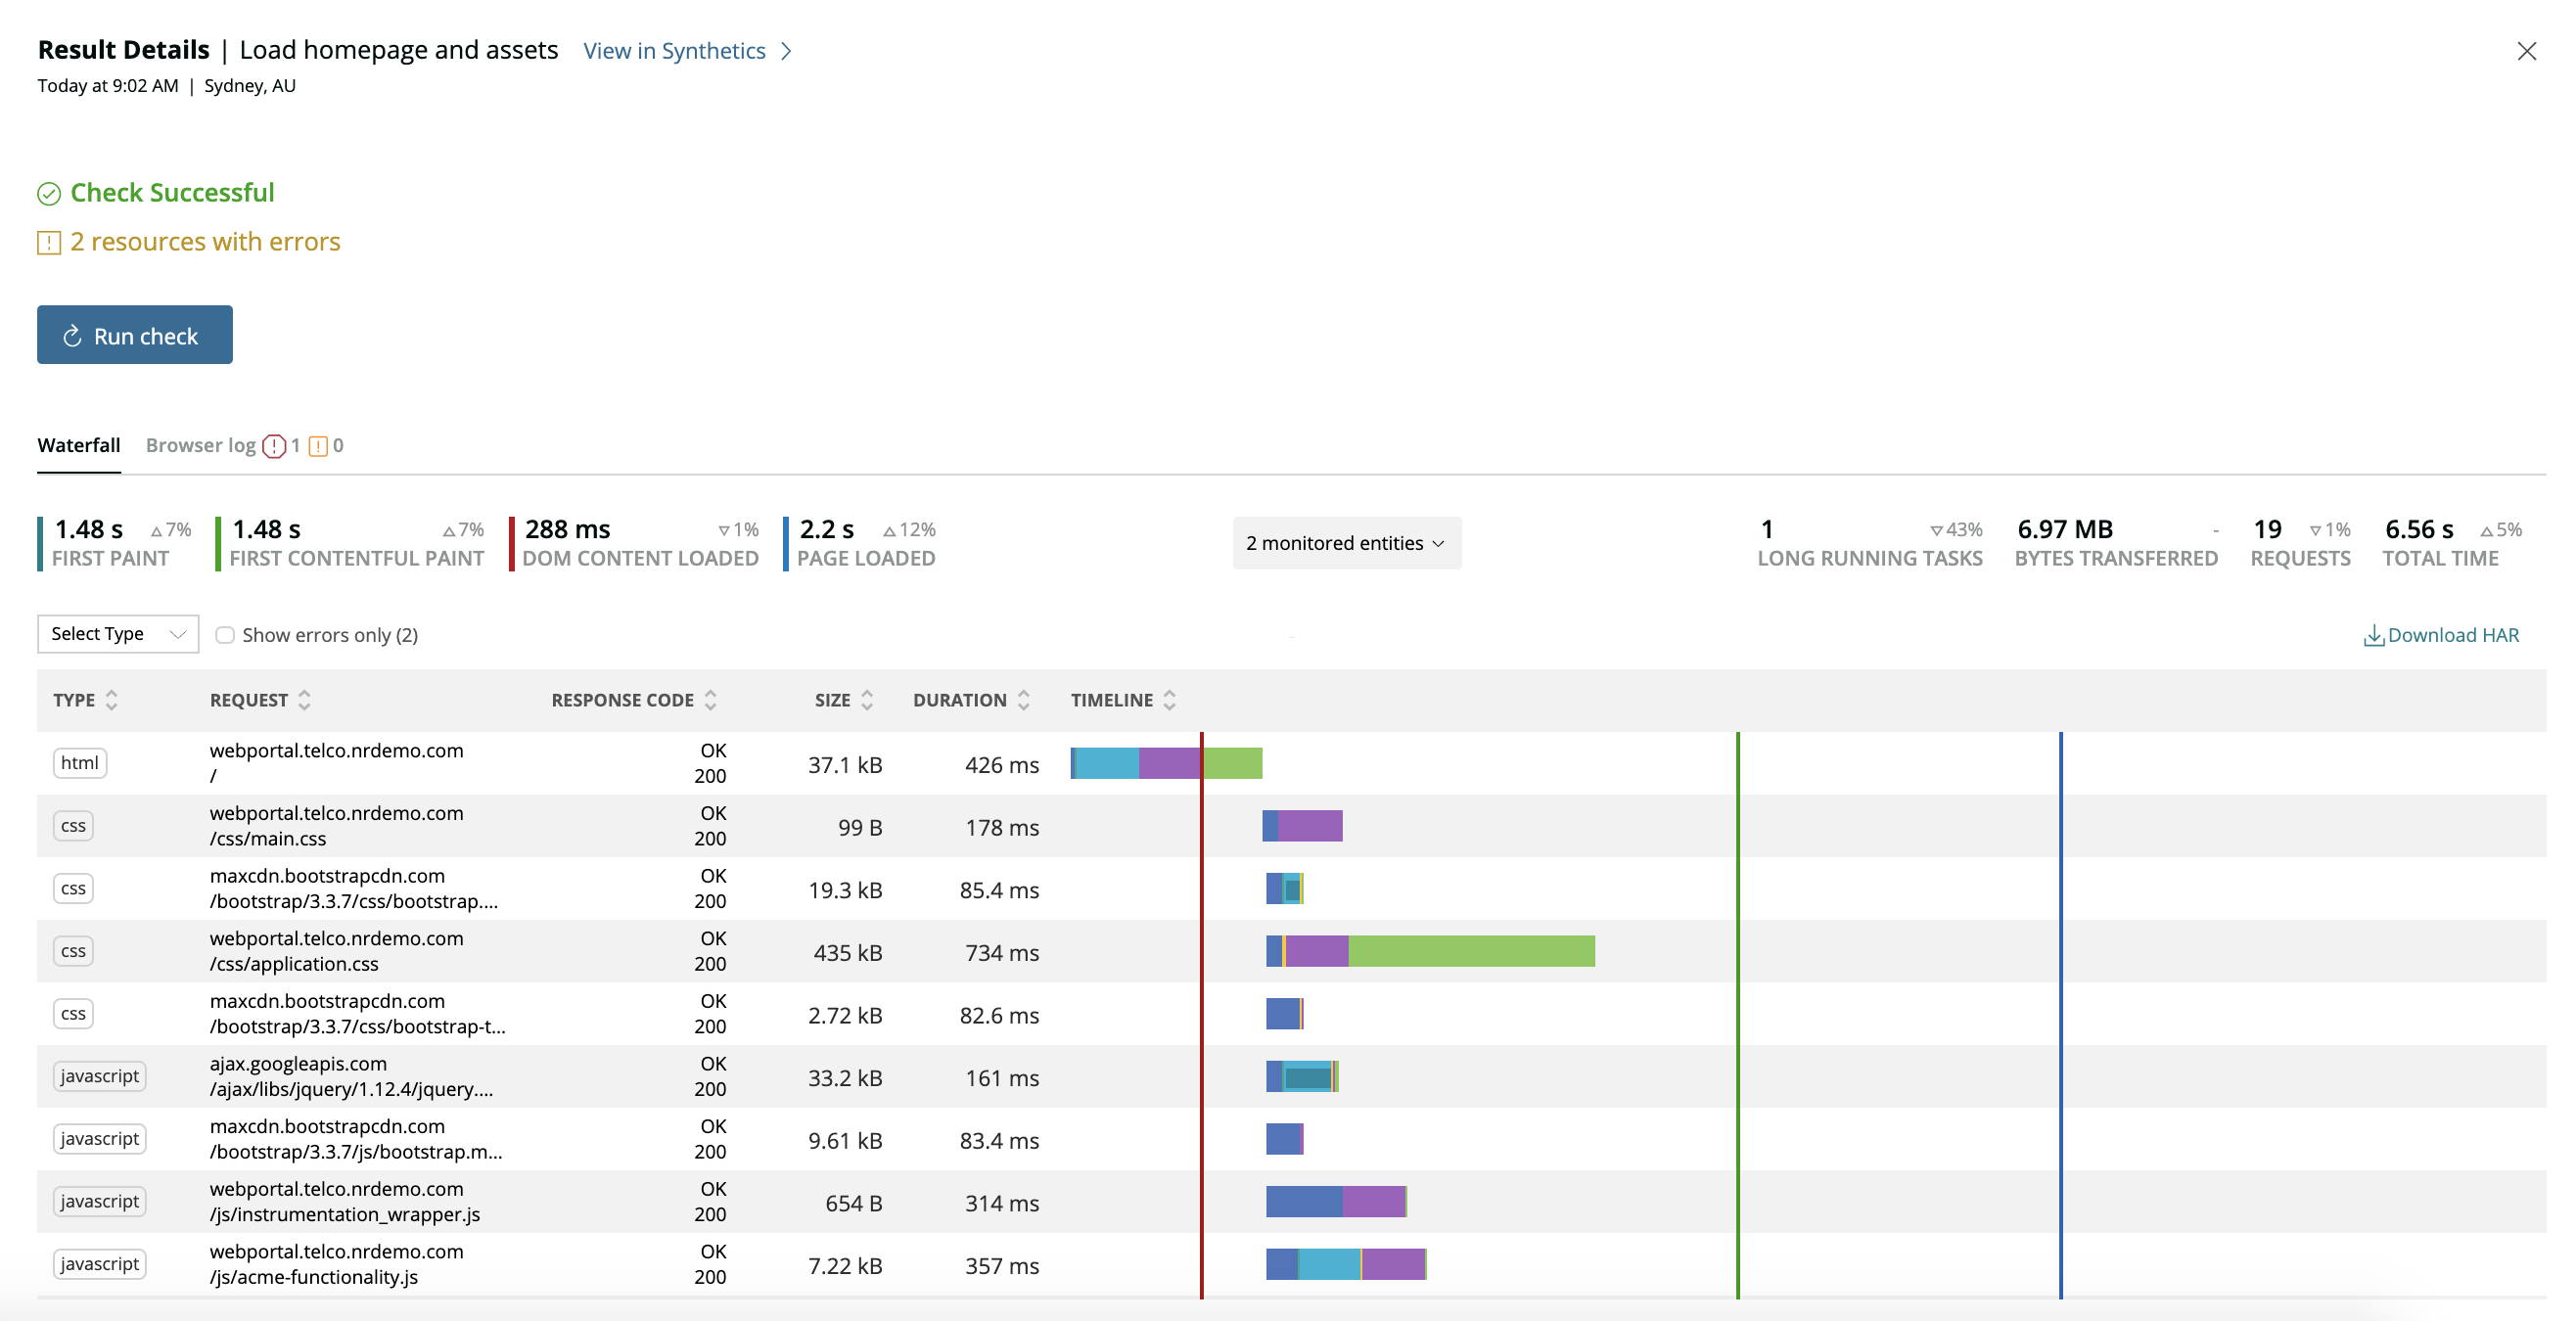
The simple Browser returns the full page performance of a single page. You need to ensure that your most heavily trafficked pages are always up and fast. Simple Browser monitors are a necessity for your home page, login page, any new marketing landing pages, any page that’s going to receive significant customer traffic.
To ensure the performance of user pathways and funnels
The scripted browser monitor provides deep context into the availability, functionality, and performance of your user pathways and funnels. Devs can utilize JavaScript, or a script recorder to simulate the customer journey, then understand how to optimize page speed, functionality, or benchmark third-party performance.
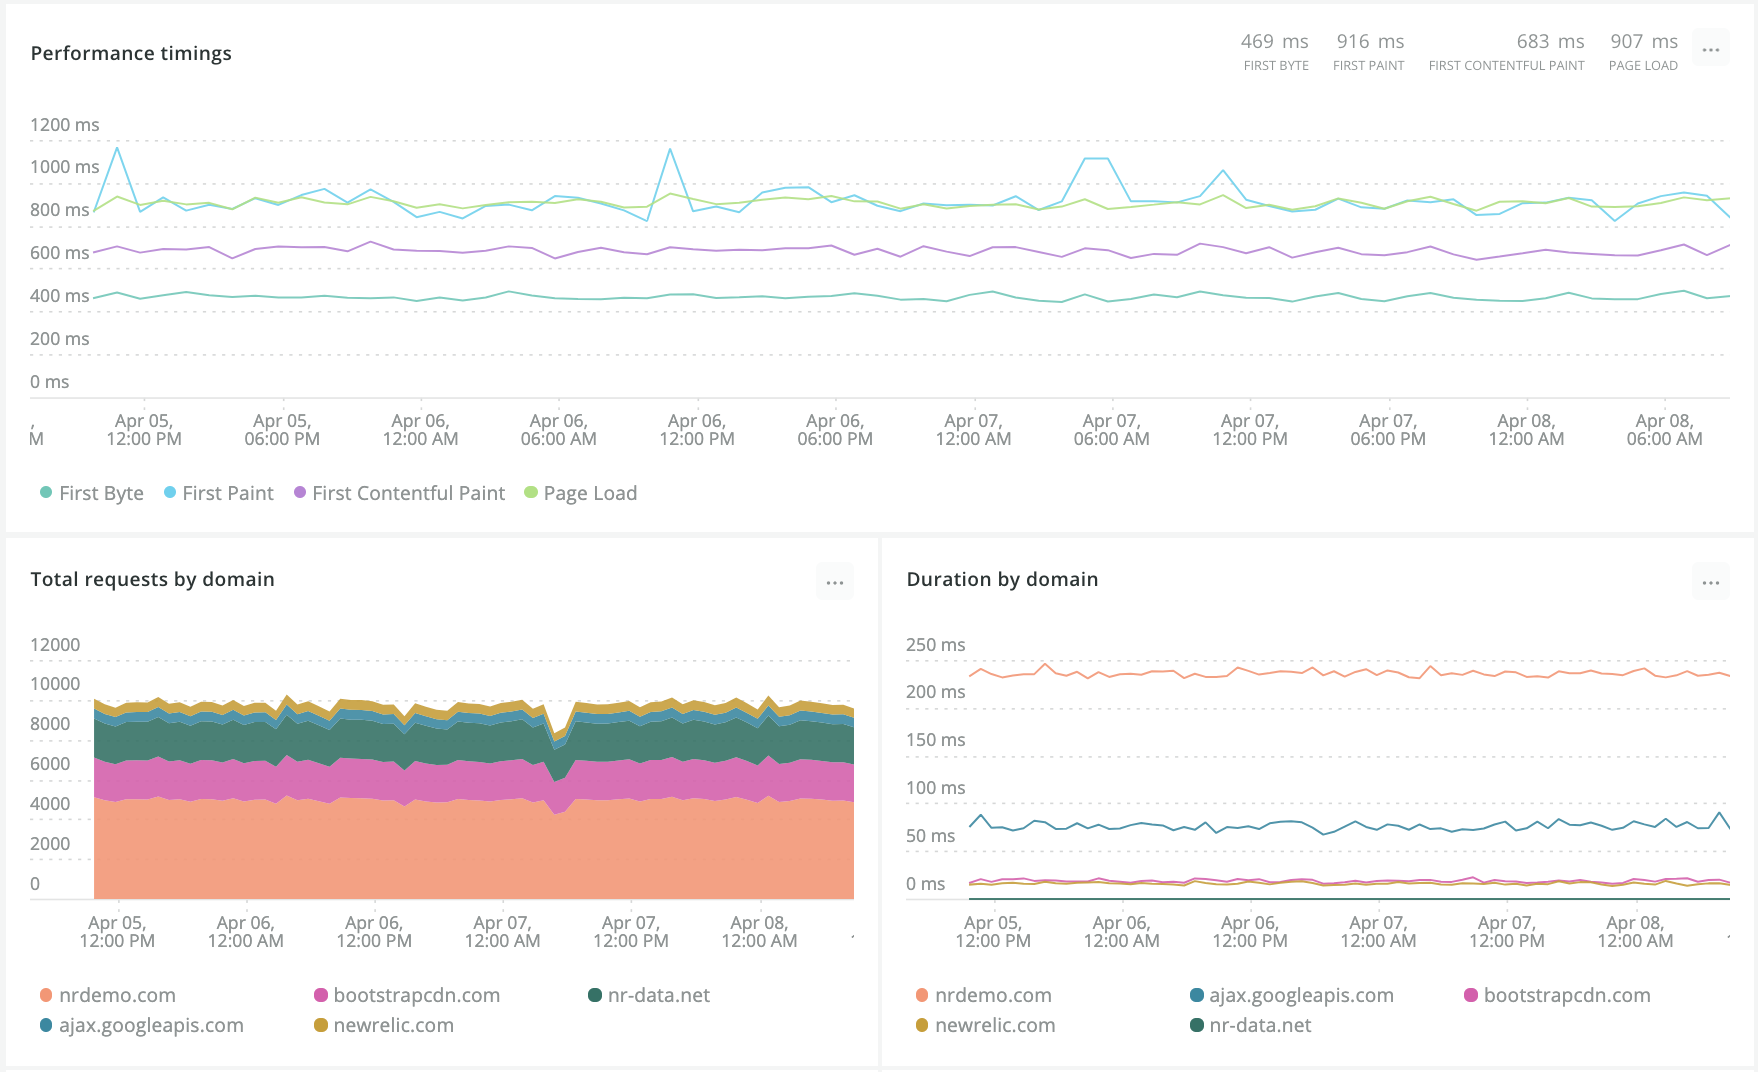
To monitor uptime and health of APIs
API test: To monitor uptime and health of your APIs, use this synthetic monitor to quickly view API uptime by location, and use the payload response from the API to get deeper information about system health.
Even more, API monitors allow you to script multiple-step API transactions. We’ve provided additional details from the network and third-parties to allow you to quickly identify where in the flow an error is occurring so you can dive in, identify the root cause, and work with the appropriate team to resolve.
Stronger Synthetics monitoring
Adding synthetic monitoring results into New Relic One connects data from customer-facing endpoints to their applications and services, which empowers teams responsible for maintaining uptime more proactively identify and resolve issues through distributed systems.
Catch problems before your customers do
Synthetics is an always-on insurance policy. It’s a proactive way to simulate end users, and measure uptime, functionality, and performance for URLs, APIs, and entire user flows.
Eliminate problems before you go live
Leveraged within your deployment process, Synthetics helps you identify and remove problems of functionality and performance while you’re still in the lab and before you go live so that you ensure fast pages on each deployment.
Troubleshoot faster through your full stack
Any synthetic monitoring solution can give you details on the uptime and performance of your customer-facing endpoints (URLs, APIs). Where New Relic offers added value is that it provides context of URLs, APIs, and customer flows, against the health of backend services and infrastructure.
Reliability teams using Synthetics within their full stack can compare outages to customer endpoints to availability of services and help provide context within their incident response.
Learn more about New Relic Synthetics, and request a demo or free trial.
The views expressed on this blog are those of the author and do not necessarily reflect the views of New Relic. Any solutions offered by the author are environment-specific and not part of the commercial solutions or support offered by New Relic. Please join us exclusively at the Explorers Hub (discuss.newrelic.com) for questions and support related to this blog post. This blog may contain links to content on third-party sites. By providing such links, New Relic does not adopt, guarantee, approve or endorse the information, views or products available on such sites.


