New Relic and Google Cloud have been collaborating closely on various initiatives to help our joint customers accelerate their migration to and adoption of Google Cloud solutions. As the first open, connected, and programmable observability platform, New Relic One already has robust solution integrations for services including Google Kubernetes Engine (GKE). Today we are excited to share details of our new solution integrations for Google Cloud Anthos and Cloud Run, further expanding our portfolio for Google Cloud.
Google Anthos and Cloud Run
Anthos is Google Cloud’s hybrid and multi-cloud platform that lets you build and manage modern hybrid applications across environments. Powered by Kubernetes and other open-source technologies, Anthos was the first open application modernization platform to offer a unified control plane and service delivery across diverse cloud environments—managed cloud, on premises, and edge. Plus, with a technology stack that simplifies everything from migration to security to platform operations, Anthos makes it easy to accelerate application development and delivery.
With Cloud Run, Google Cloud brings serverless deployments to containers. Cloud Run is a managed compute platform that automatically scales your stateless containers. Cloud Run abstracts away all infrastructure management, so you can focus on what matters most — building great applications. You can run your containers in fully managed Cloud Run, or on Cloud Run for Anthos, which supports GKE on Google Cloud, on-premises and multi-cloud environments. Cloud Run is built from Knative, an open source, Kubernetes-based platform to build, deploy, and manage modern serverless workloads—ensuring that your applications are built on an open standard.
New Relic One
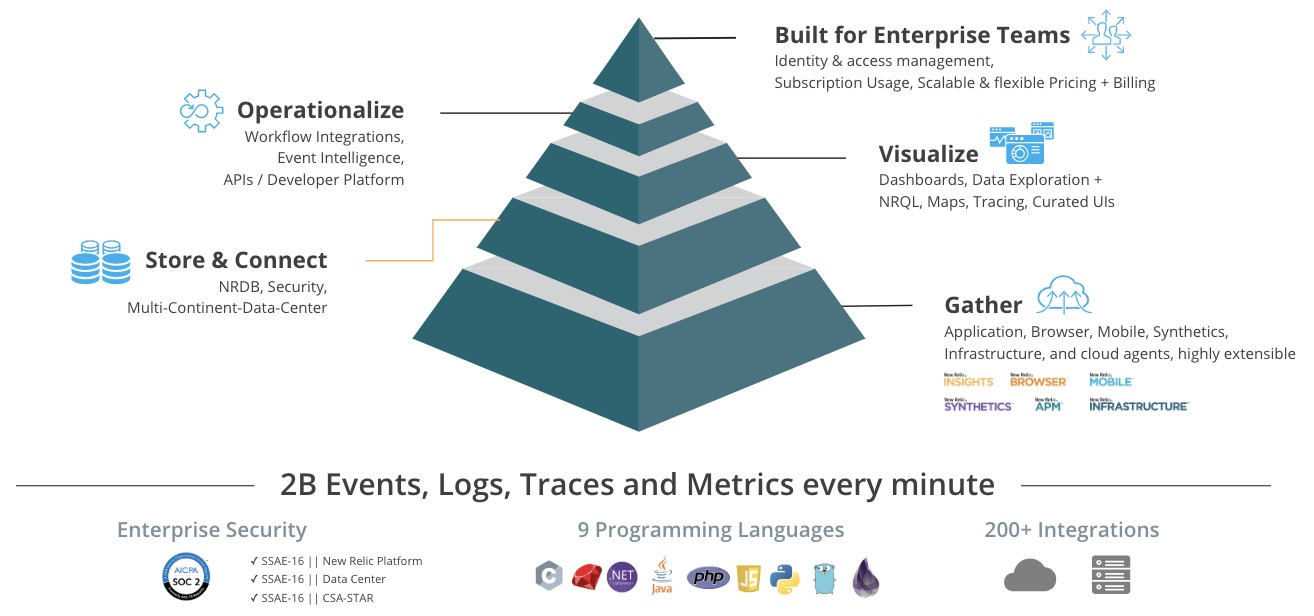
New Relic One is the industry’s first open, connected, and programmable observability platform. New Relic One delivers data gathering, visualization and analysis of metrics, events, logs, and traces in one place—giving you full insight into your multi-cloud deployments. New Relic One cuts through complexity, provides context, and lets you see across organizational boundaries, so you can quickly find and fix technology and business problems, and create more perfect software, customer experiences, and businesses.
New Relic One’s Kubernetes monitoring capabilities provide a unique approach to monitoring for containerized applications orchestrated using Kubernetes and deployed on a customer’s own infrastructure or on leading public cloud services. With the Kubernetes cluster explorer, New Relic provides a multi-dimensional representation of Kubernetes clusters that allow teams to drill down into Kubernetes data and metadata in a high-fidelity, curated UI that simplifies monitoring of complex Kubernetes deployments. Teams can use cluster explorer to observe performance and dependencies across any Kubernetes environment; and to troubleshoot failures, bottlenecks, and other abnormal behavior. All of these capabilities help to ensure that our customers’ applications are always available, running fast, and delivering optimal customer experiences and business impacts.
Solution integrations for Anthos hybrid and Cloud Run
The New Relic Kubernetes solution for Google Cloud Anthos gives you infrastructure-centric and application-centric views into your Kubernetes clusters. The Kubernetes integration reports on data and metadata about the nodes, namespaces, deployments, ReplicaSets, pods, clusters, and containers running on Google Cloud Anthos across hybrid cloud environments (including on-premise and cloud deployments), which allows you to monitor frontend and backend applications as well as the underlying hosts running your clusters. Monitoring Google Cloud Anthos with New Relic provides total visibility, alerting, and dashboards for all Kubernetes entities that live among your applications.
You can leverage the New Relic integrations to expand visibility into Cloud Run for Anthos deployments. You can also identify the containers and applications deployed with Cloud Run, the performance of the containers and the applications invoked, failed containers, restarts, and other telemetry data.
With New Relic APM 360, you can instrument to monitor the applications running in these containers and correlate data across the entire stack—all the way from your core infrastructure to Kubernetes clusters (and entities) to the applications. With New Relic Distributed Tracing, you can trace the path of a request as it travels across the Kubernetes stack, discover the latency of the components along that path and identify which component in the path is creating the performance issues. This provides for a curated dashboard experience that abstracts and demystifies the complexity of the Kubernetes and serverless deployment stack.
Given the multiple layers in the Anthos deployment stack and across clouds, it is important to capture the logging information across these layers—providing correlation and context with metrics, events, and tracing data coming out of the stack. New Relic Logs provides “logs in context” capabilities that focus on bringing context, curation, and intelligence into the logging conversation, leveraging New Relic application and infrastructure metrics, dashboards and data visualizations, event correlations, and other resources to paint a complete and integrated picture of a customer’s application environment running on Anthos and Cloud Run. The New Relic Kubernetes events integration watches for events happening in your Anthos clusters and sends those events to New Relic for correlation and visualization.
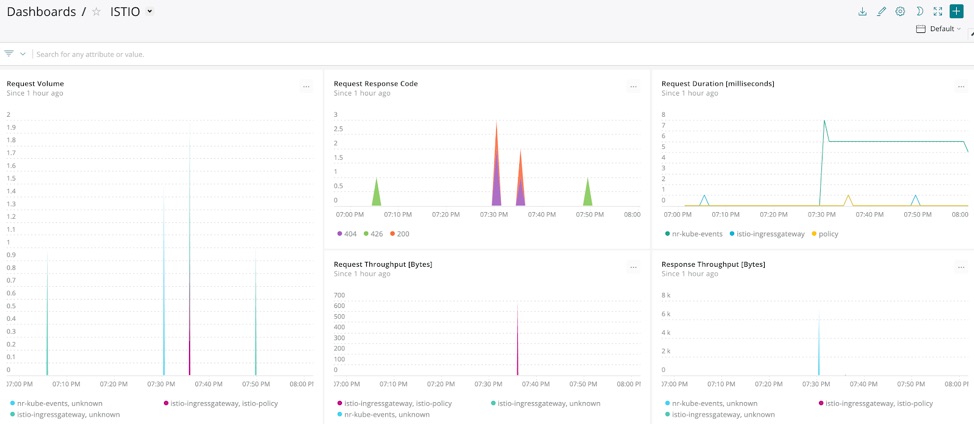
In addition, using the New Relic Istio adapter, you can monitor Istio metrics and tracing telemetry data. The newrelic-istio-adapter has a default configuration that sends metrics representing the “four golden signals” for all services within the service mesh: error rates, latency, request volume, and throughput.
Getting started with the New Relic solution for Google Anthos and Cloud Run
If you are deploying onto Google Cloud, you can get started with Anthos simply by creating a new GKE cluster with Istio enabled in your project. If deploying on-premises, download and install GKE On-Prem and register it with your Google Cloud account. Once registered, you can manage your On-Prem clusters just like any existing Kubernetes clusters. You can also incorporate your services as a part of an Istio service mesh to get observability and enforce security.
Next, you can install Cloud Run on both on-premise and cloud environments.
Deploy New Relic as follows:
- Install the New Relic Kubernetes integration
- Install the New Relic Kubernetes events integration
- Install New Relic logging for Kubernetes
- Configure the New Relic Google Cloud integration
- Install the New Relic Istio adapter
- Install the APM agent
Navigating Anthos and Cloud Run deployments with New Relic
Let’s look at some use case scenarios for “out-of-box” observability of Anthos and Cloud Run using New Relic.
Kubernetes cluster deployments
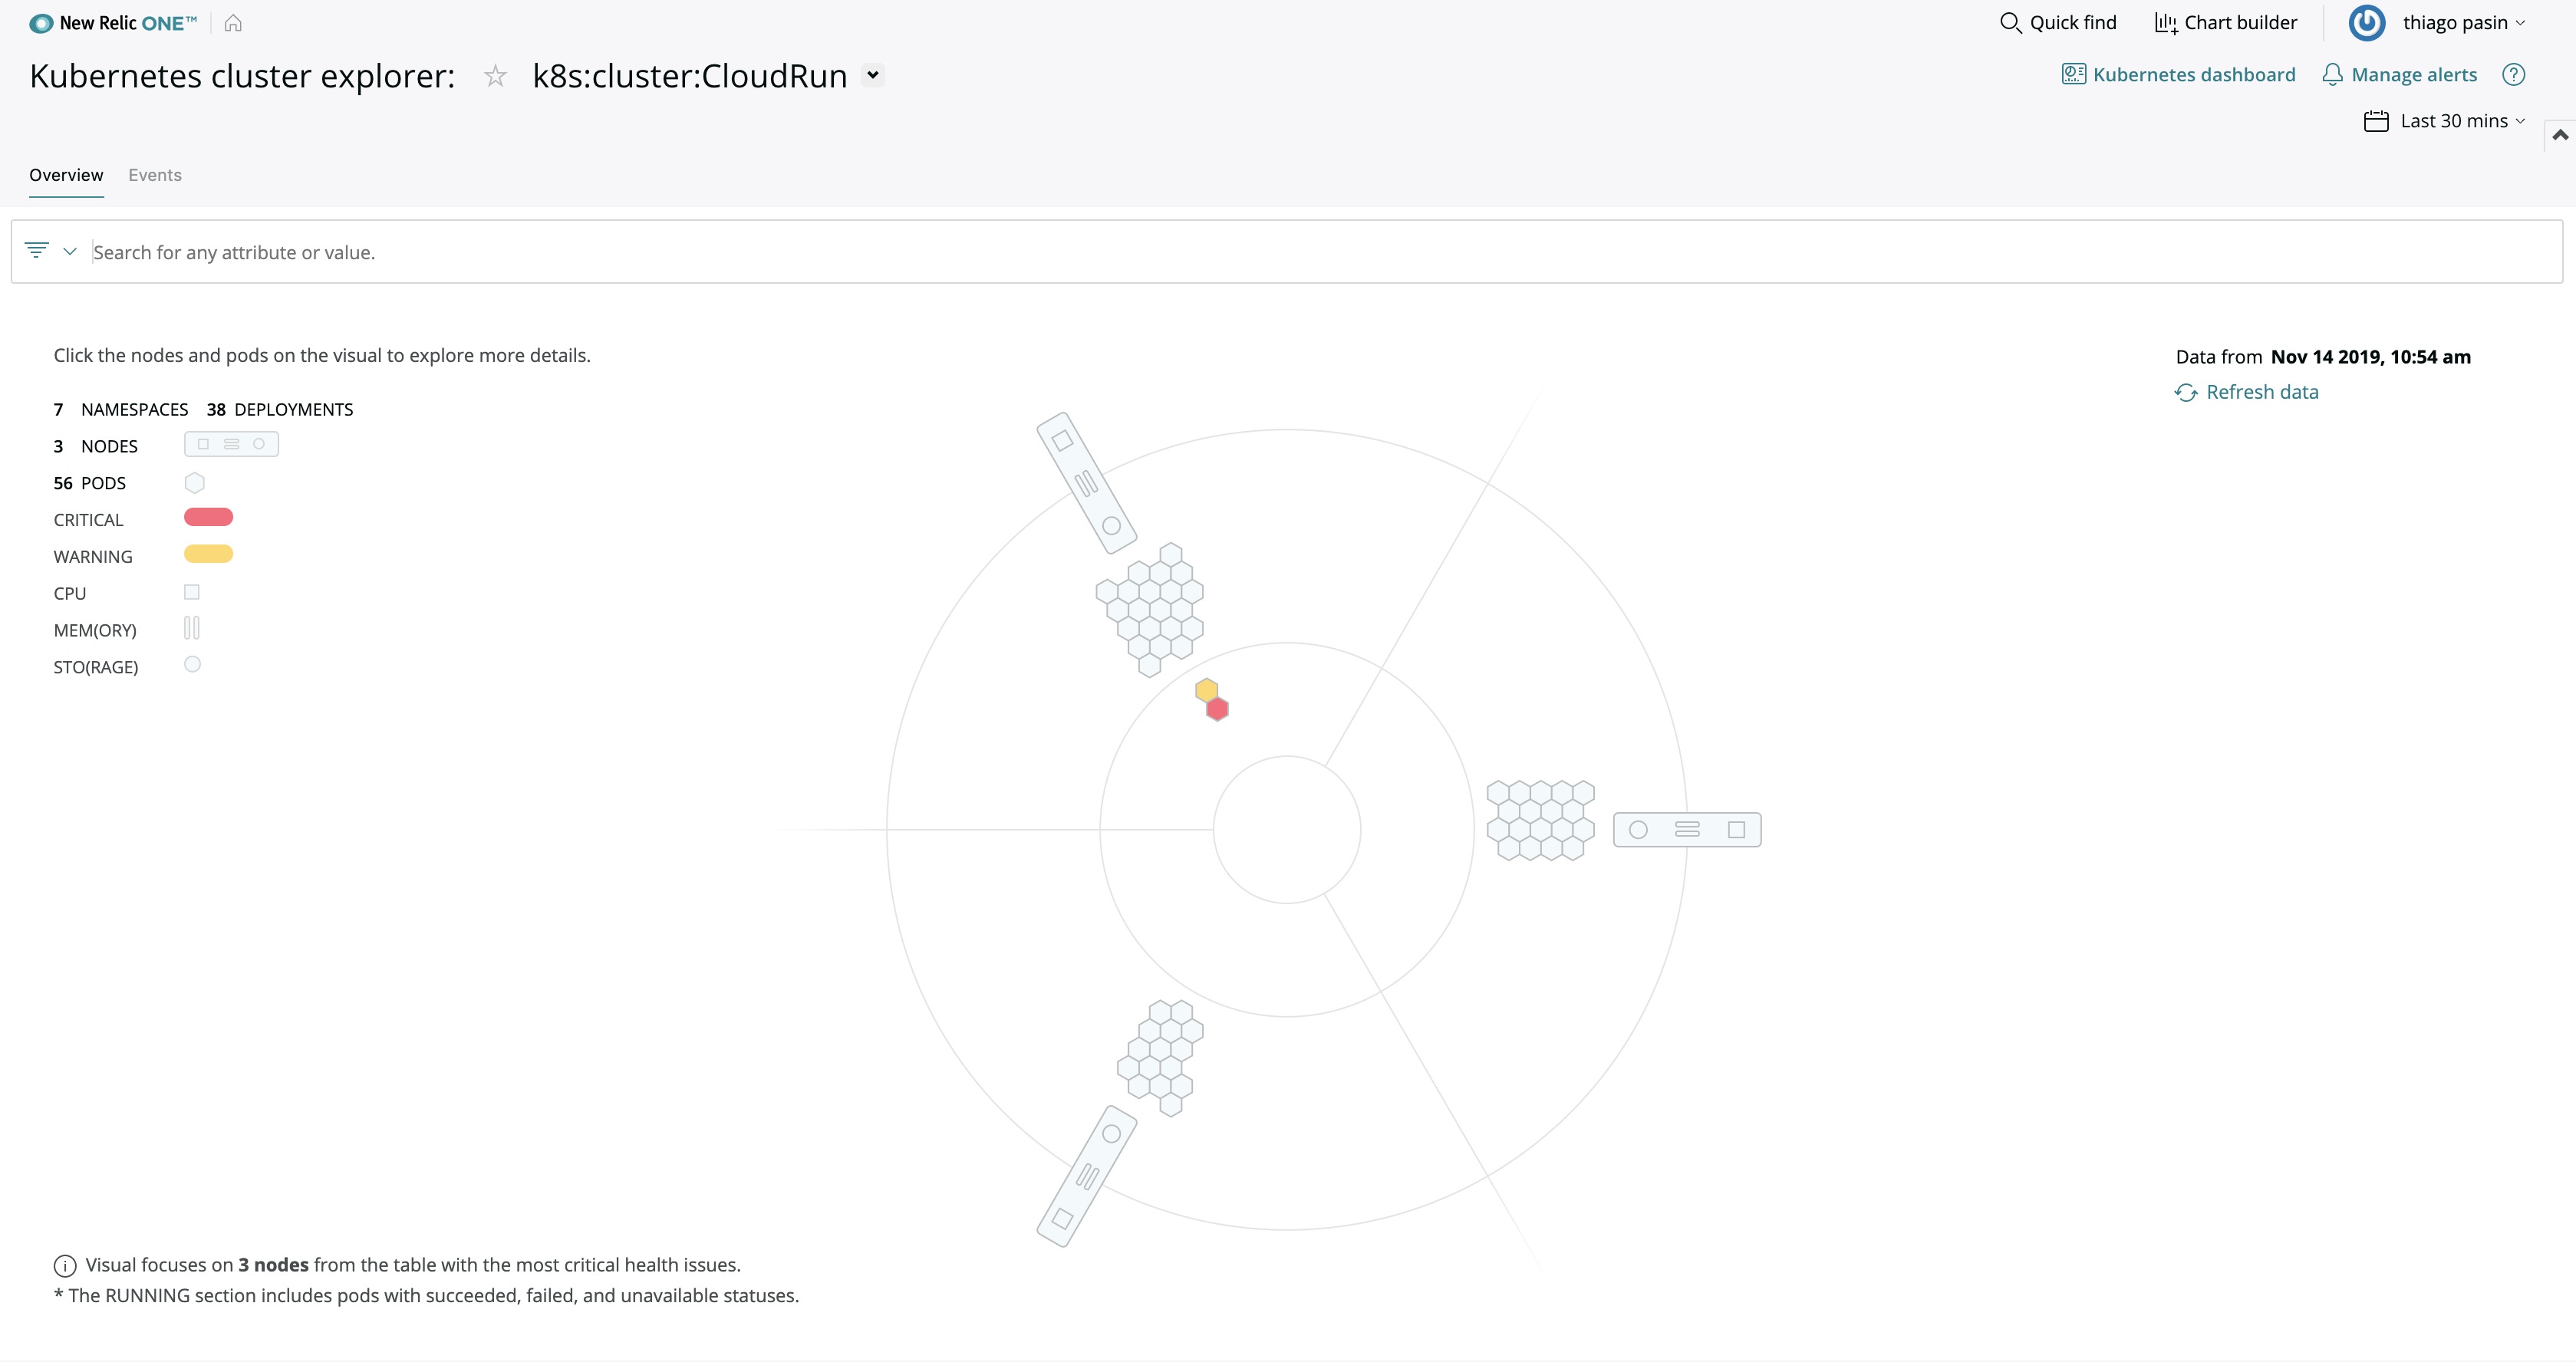
Start with the New Relic Kubernetes cluster explorer, which provides out-of-box visualization for on-premise and cloud Anthos clusters. Pick which cluster(s) you want to view; cluster explorer will visualize your selection as a series of four concentric rings:
- The outer ring shows the nodes of the cluster, with each node displaying CPU, memory, and storage performance metrics that provide an at-a-glance understanding of the node’s overall health.
- The next ring reveals information about the distribution and status of the pods associated with a selected node.
- The third ring displays pods that have breached an alerting threshold—indicating that these pods may have health issues even if they are still running.
- Finally, the inner ring displays pods that are not running or that Kubernetes is unable to schedule—due to a lack of resources, for example, or because the wrong container image was specified.
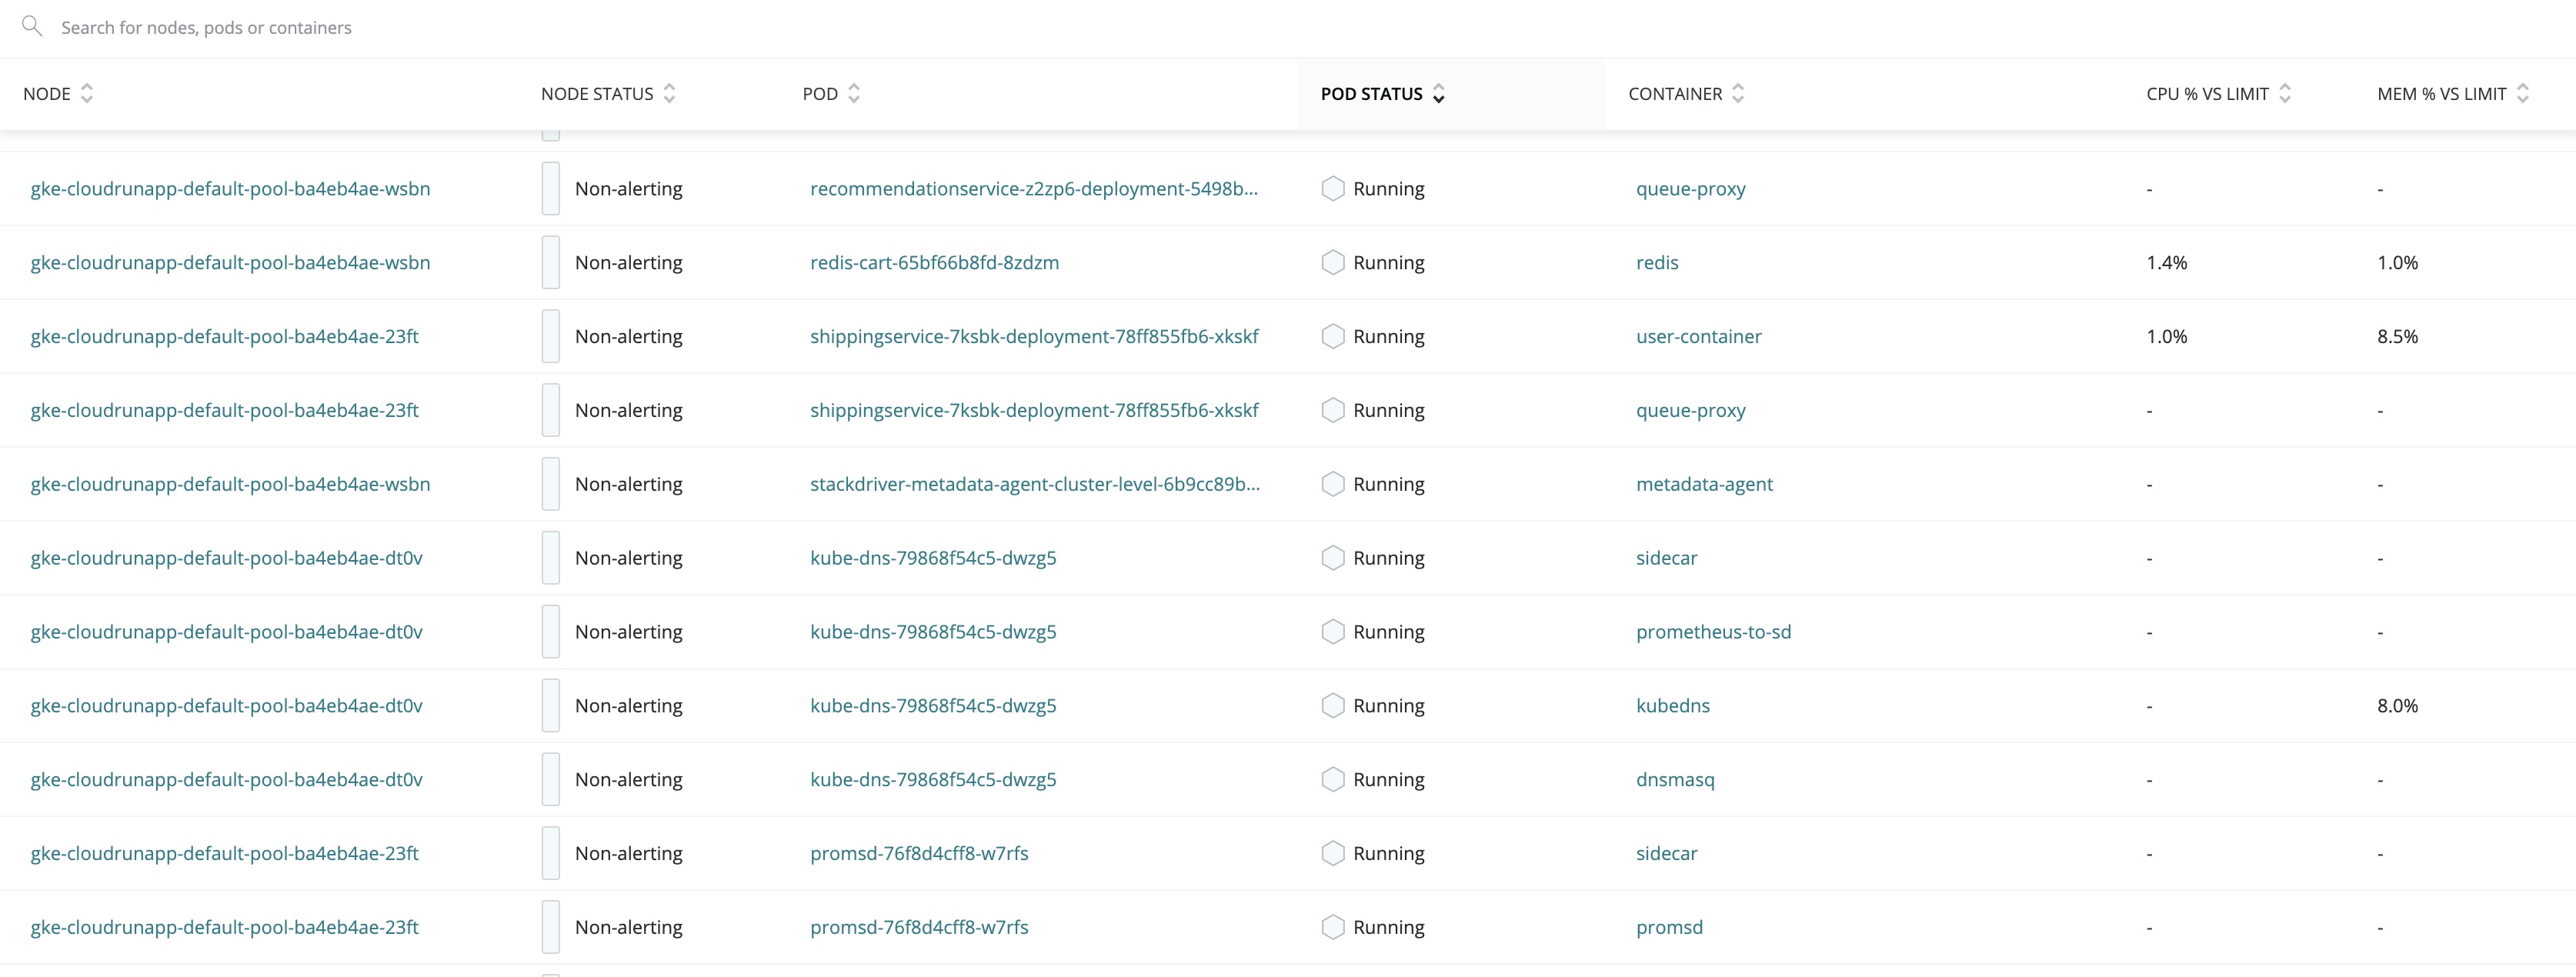
- Underneath the cluster explorer is a complete list of nodes, pods, and containers in a cluster. You can then sort by these by status or based on resource usage for troubleshooting purposes, as shown in the following screen shots:
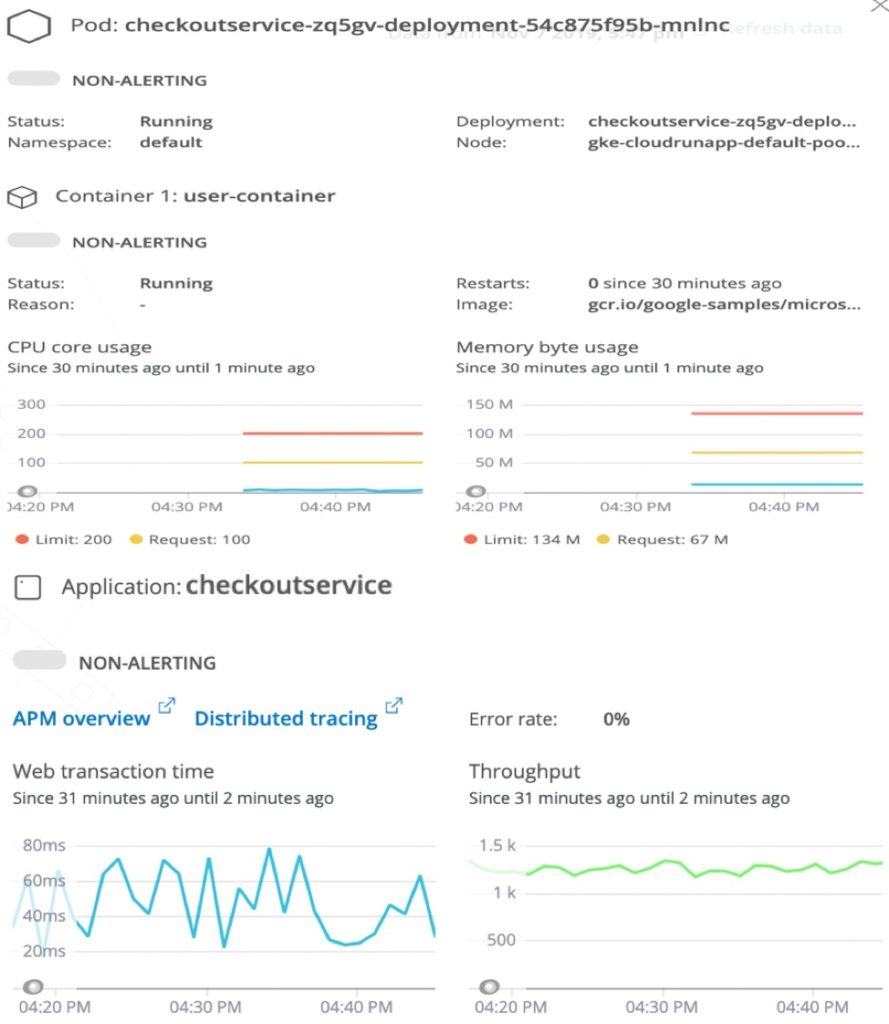
Clicking on a pod will access a detailed set of performance metrics for the pod, as well as for its underlying containers and running applications. At the application level, as we show in the following screen shot, this includes access to metrics that track response time, throughput, error rate, and violations:
Application visibility
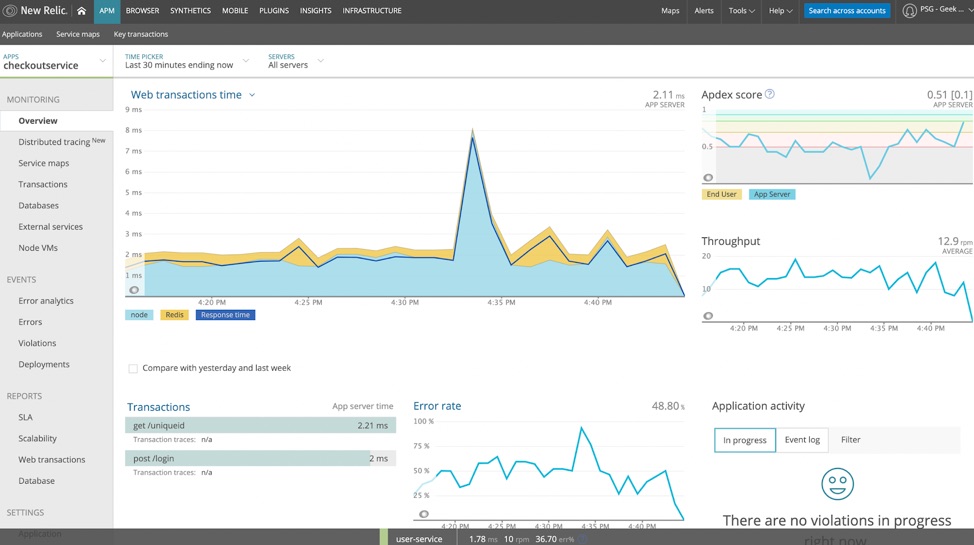
The basic application information running on the containers is presented at the pod level. You can click on “APM overview” to get detailed application metrics. You can also launch directly into New Relic distributed tracing for troubleshooting, as shown in this screen shot:
Cloud Run deployments
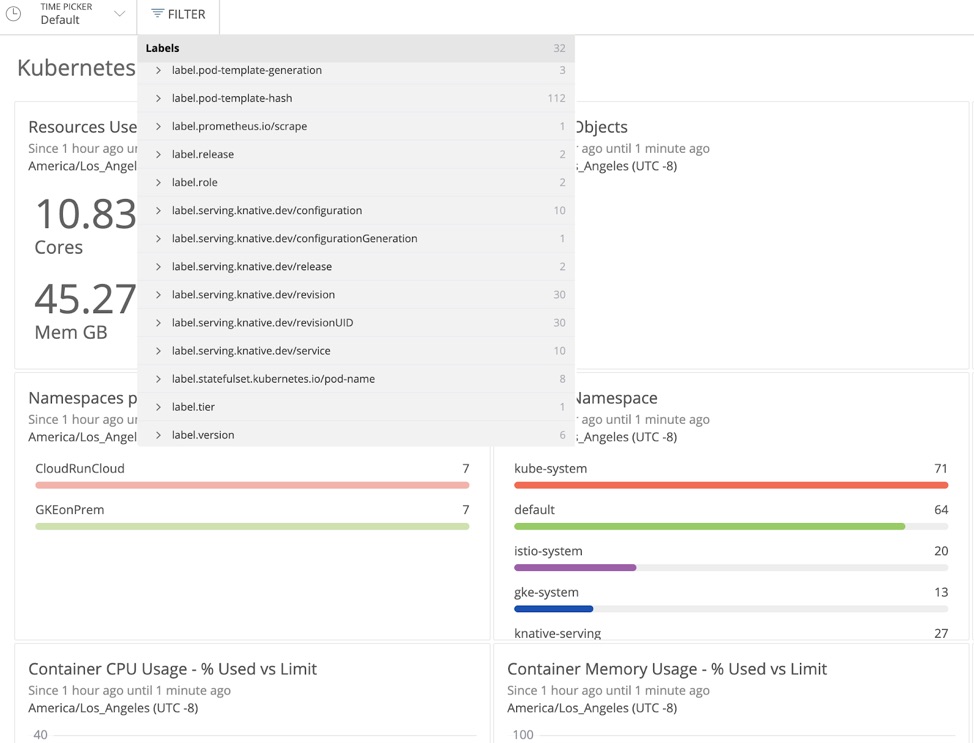
Labels created by your Cloud Run application will automatically populate the visualization. This gives you the ability to filter by a specific service, release, and configuration. You can also review the history of containers and completed runs over a period of time on Cloud Run by querying the dashboard using a specified time span, as shown here:
Kubernetes log data
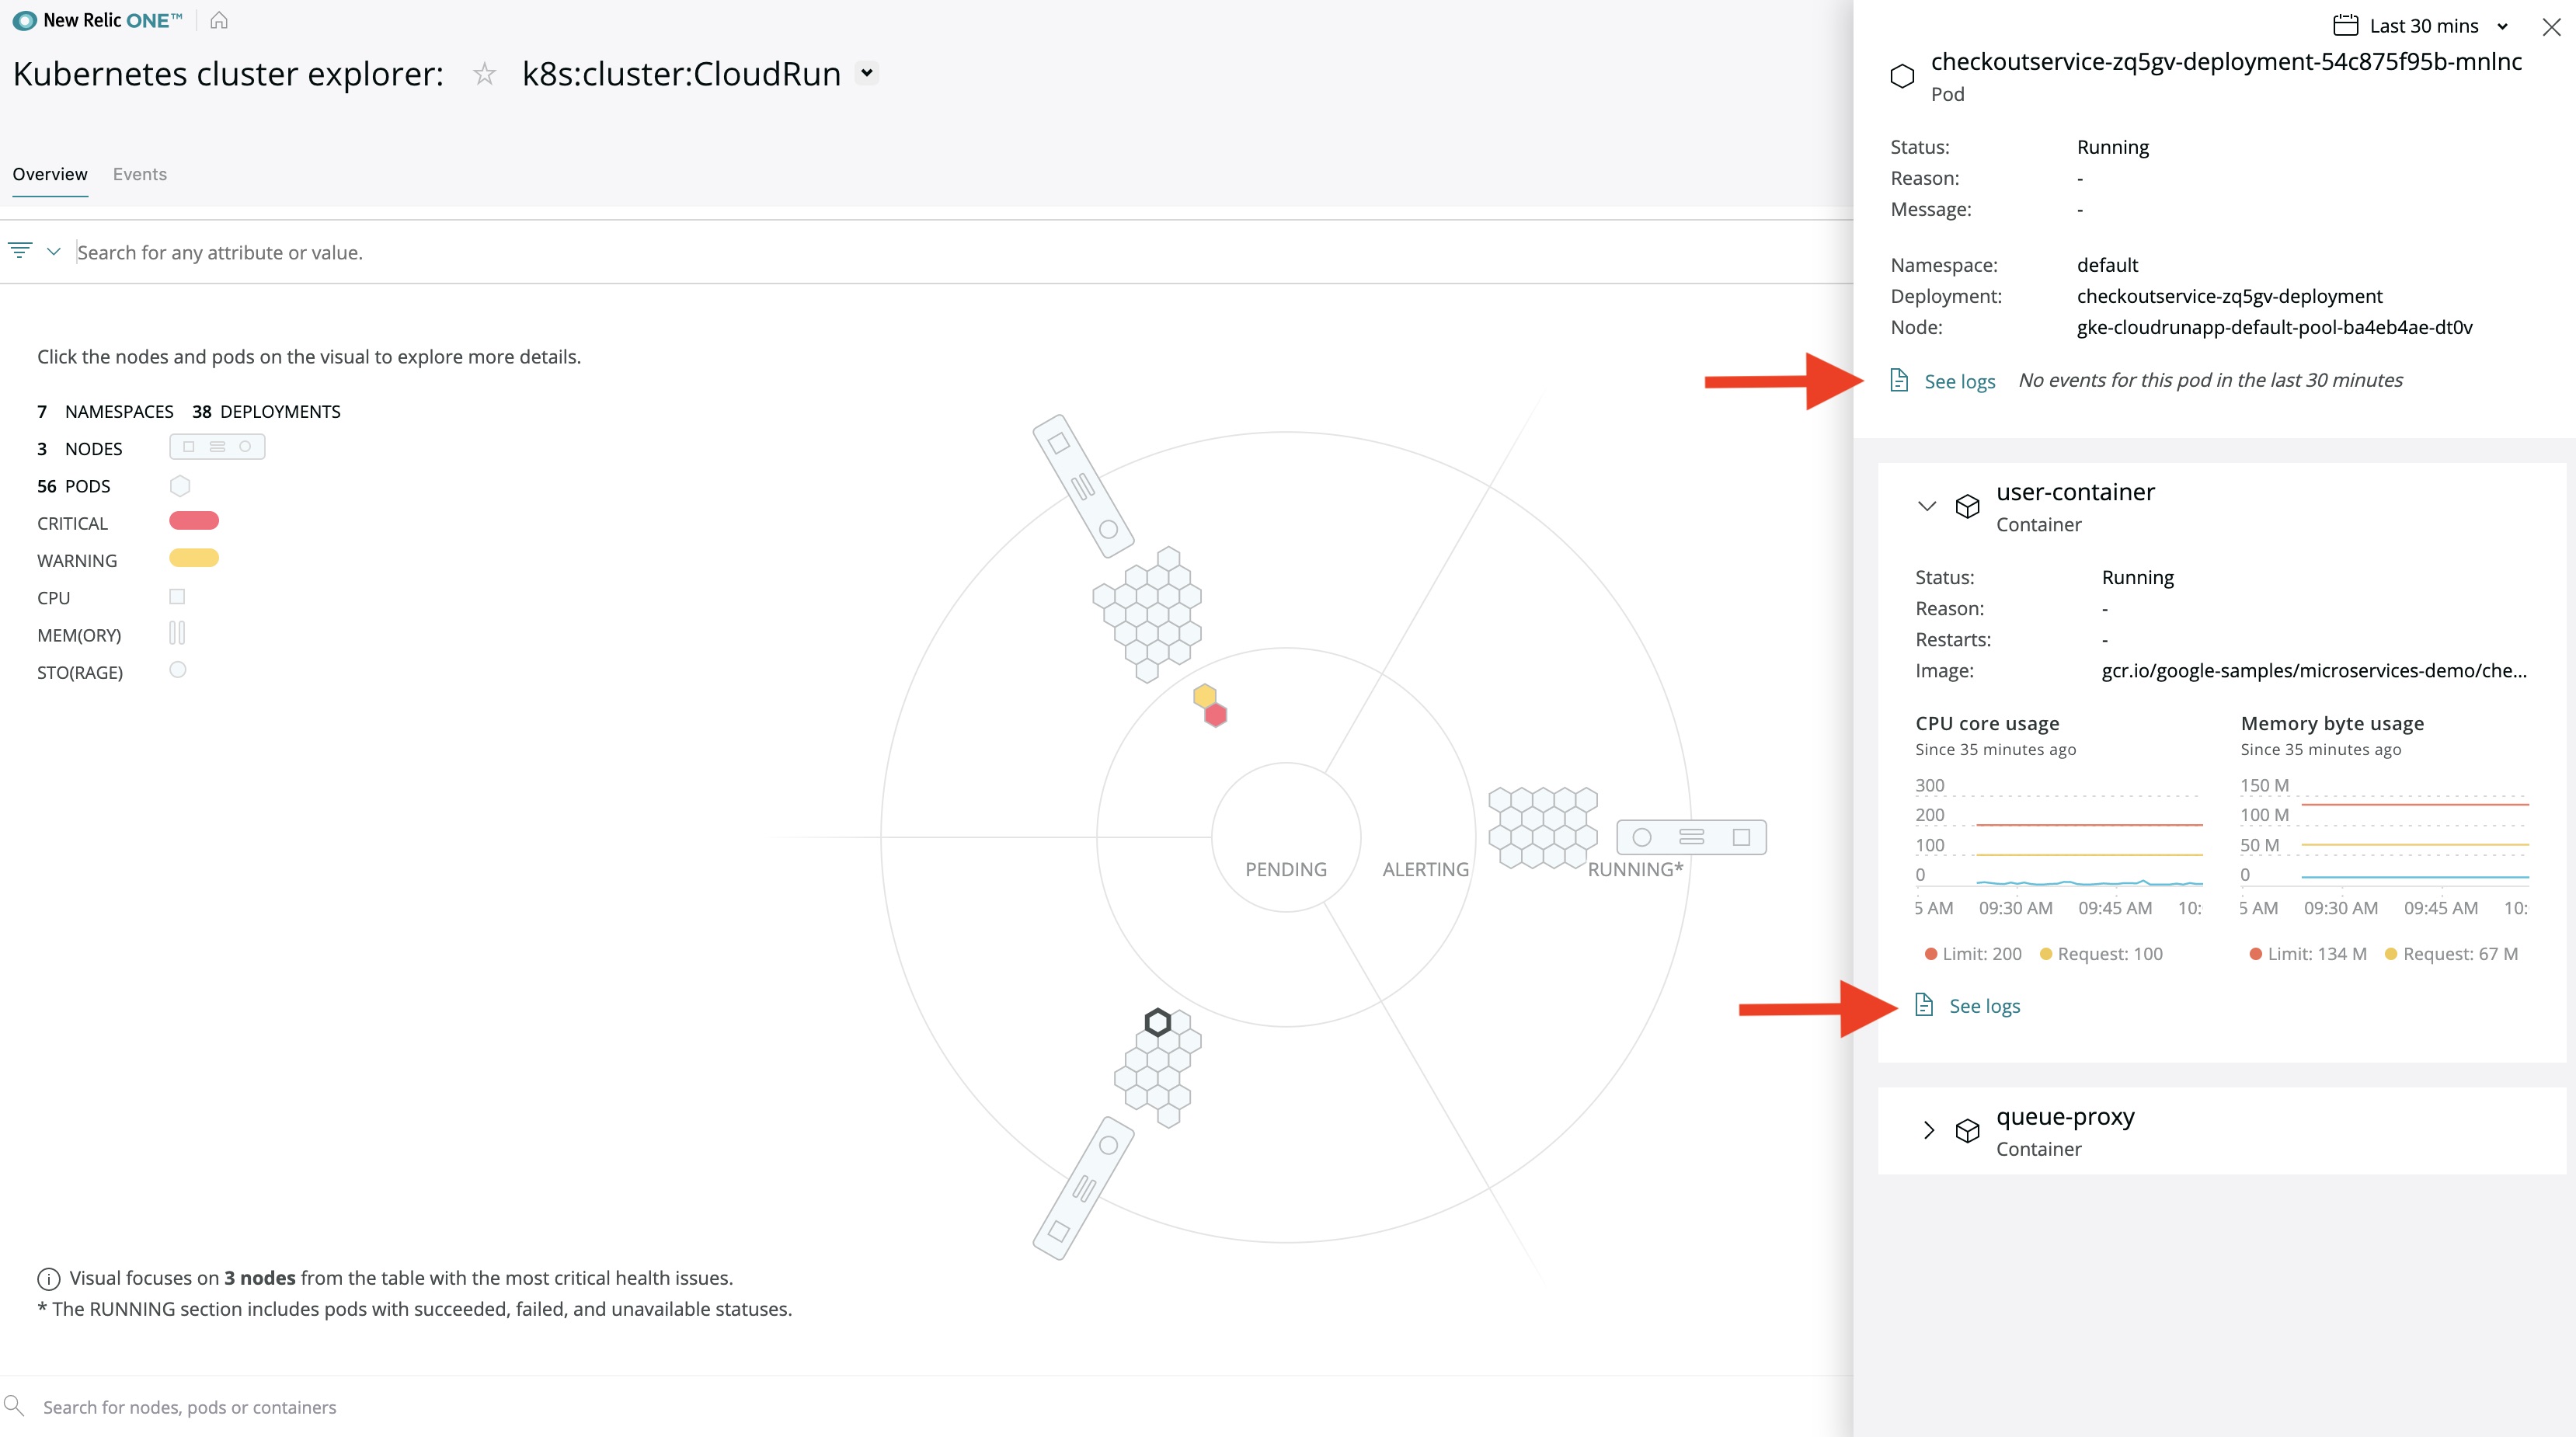
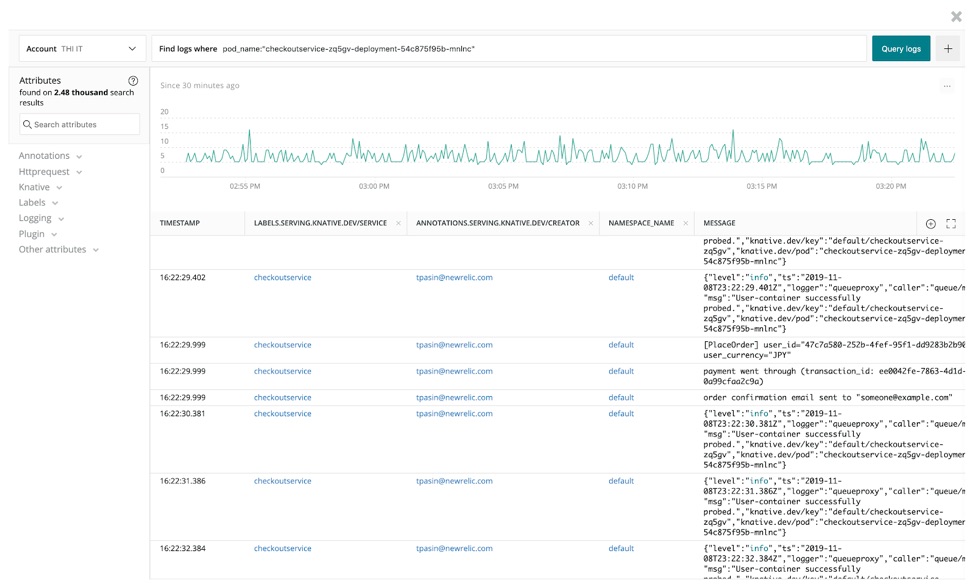
Kubernetes logs are captured and presented in context by automatically connecting with data flowing from other New Relic One components. This includes data from New Relic APM 360 and New Relic Infrastructure, in addition to Kubernetes cluster explorer. Clicking on a pod (hexagon icon) on cluster explorer generates a link to see the logs specific to that pod or container. Clicking on “see logs” (as noted by the arrows in the following screen shot) will get you a list of all logs associated with that pod (refer to the second screen shot below):
Kubernetes events
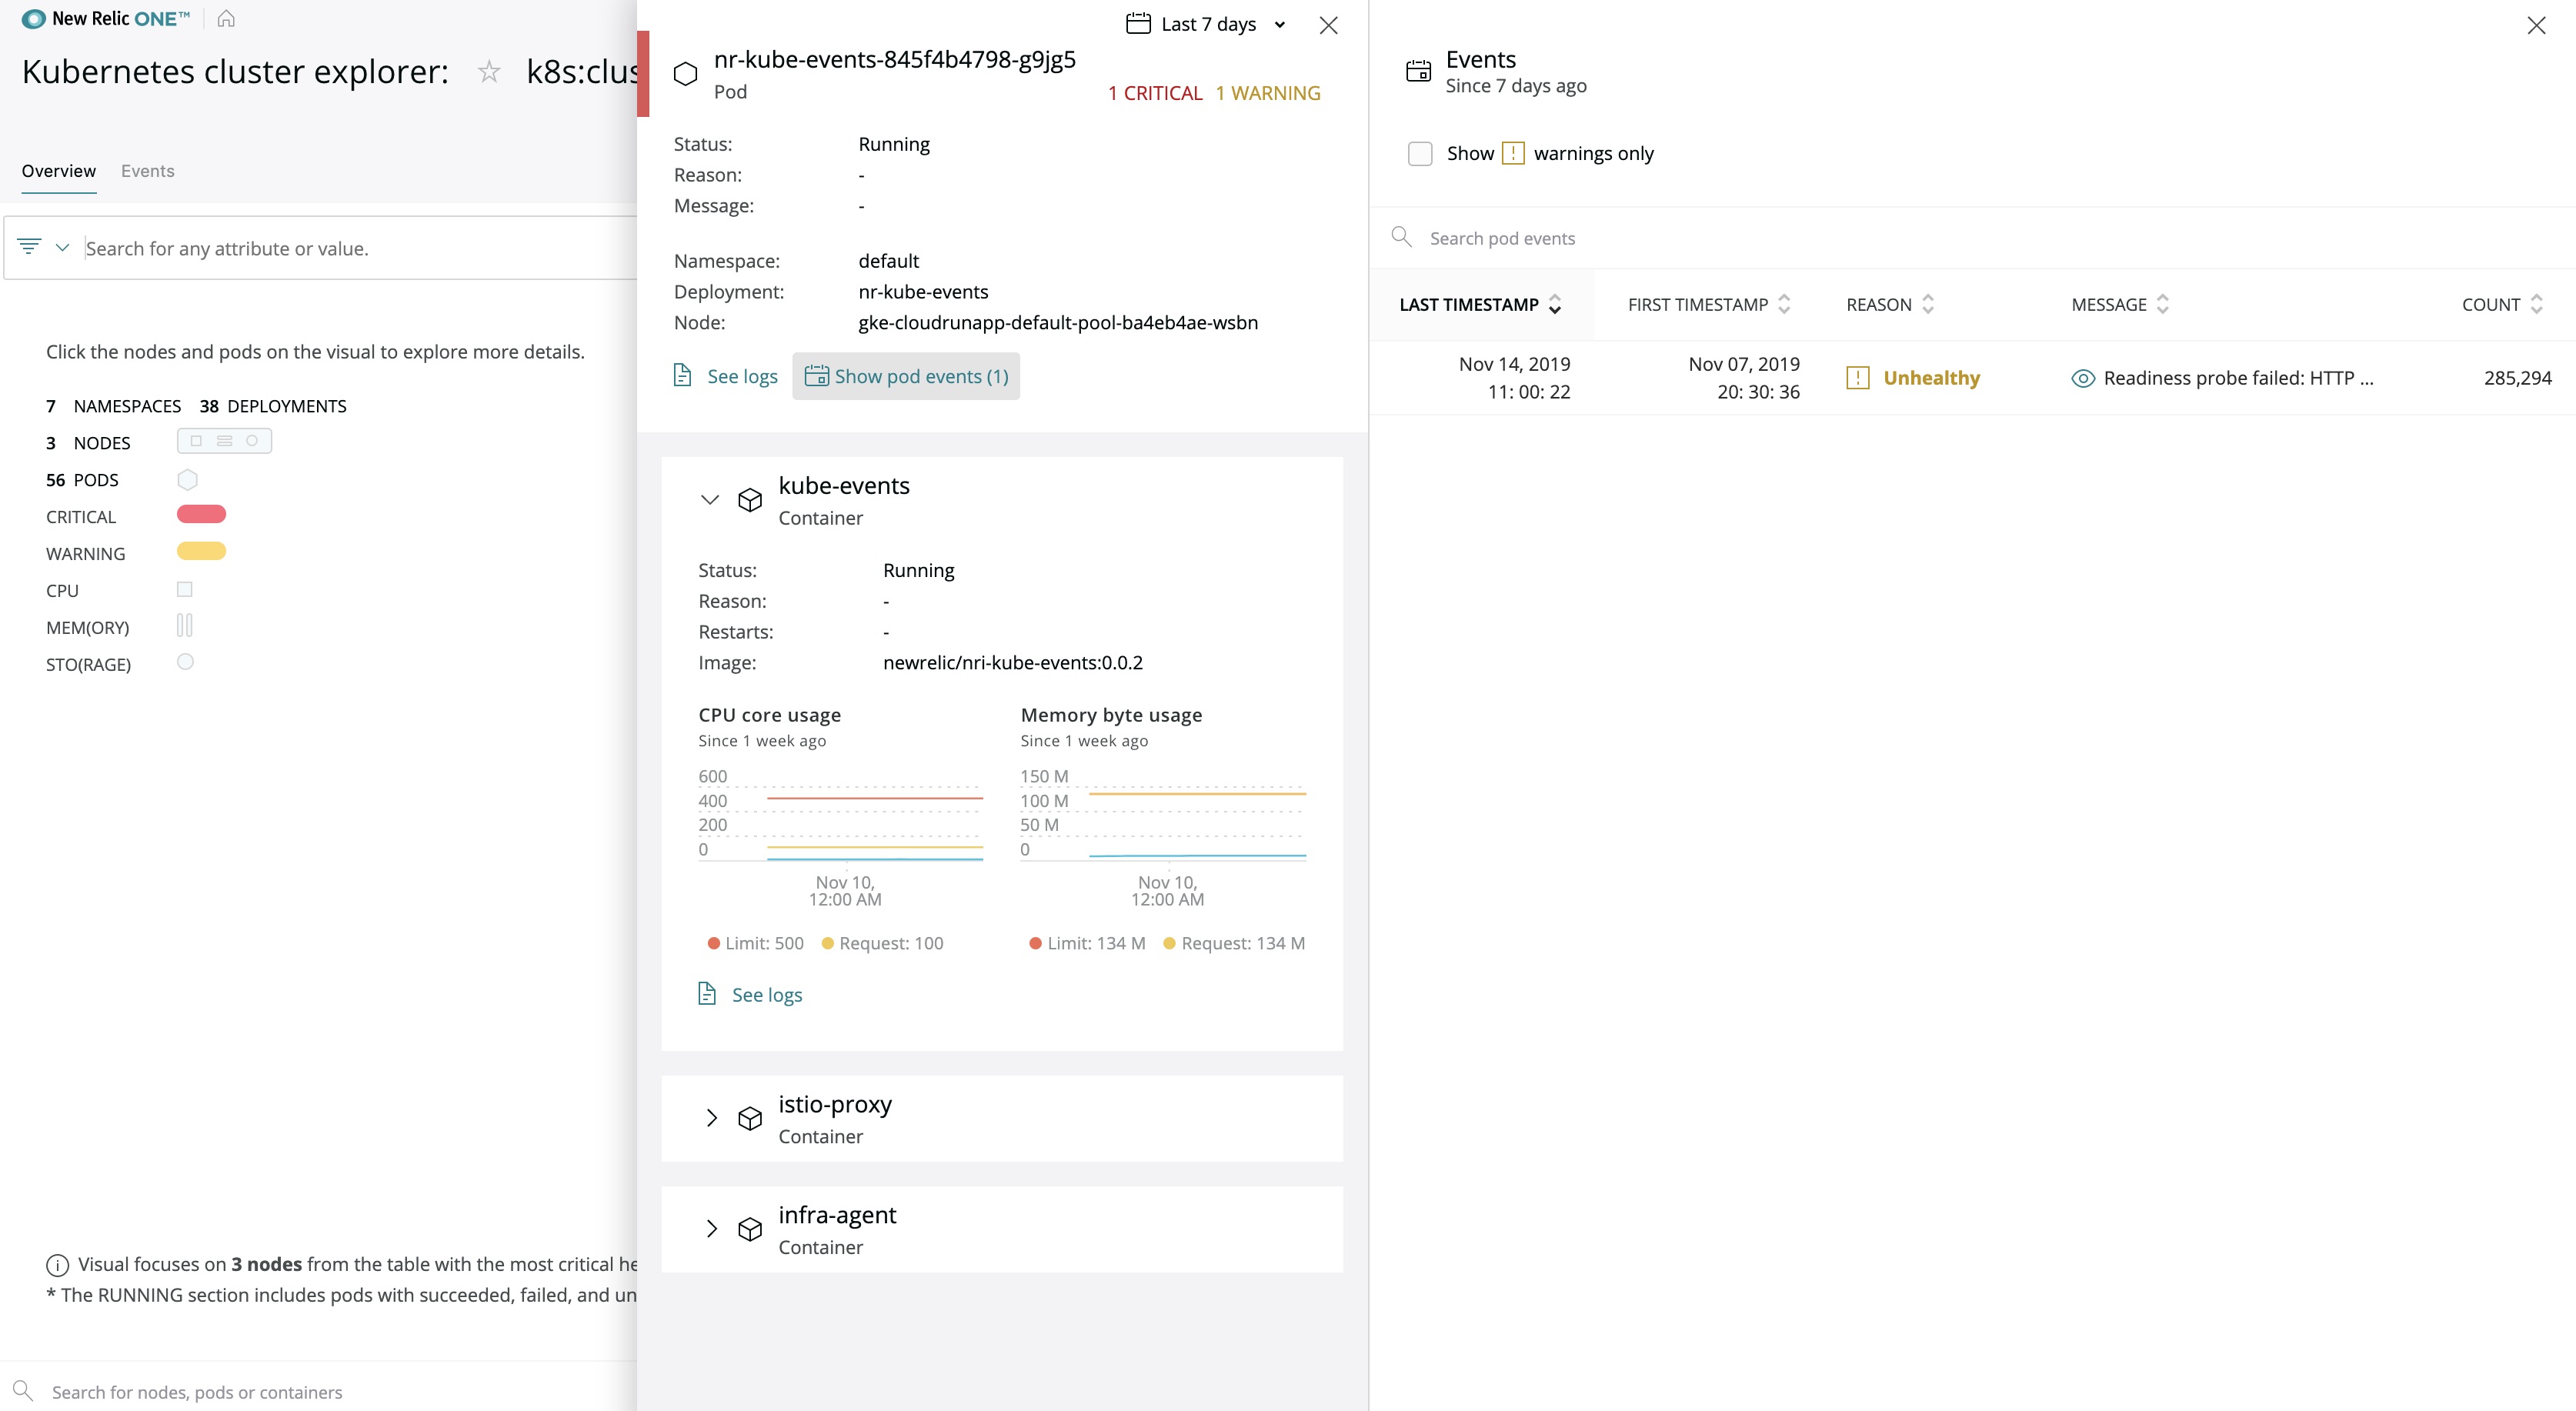
New Relic Kubernetes events integration watches for events happening in your Kubernetes cluster and sends those logs to be visualized in the New Relic platform. From the Kubernetes cluster explorer you can quickly select a pod and view associated events. The following screenshot shows a pod with an event for “Readiness probe failed”:
Istio metrics
Istio metrics representing the “four golden signals” for all services within the service mesh—error rates, latency, request volume, and throughput—are captured automatically and displayed as shown here:
Alerting
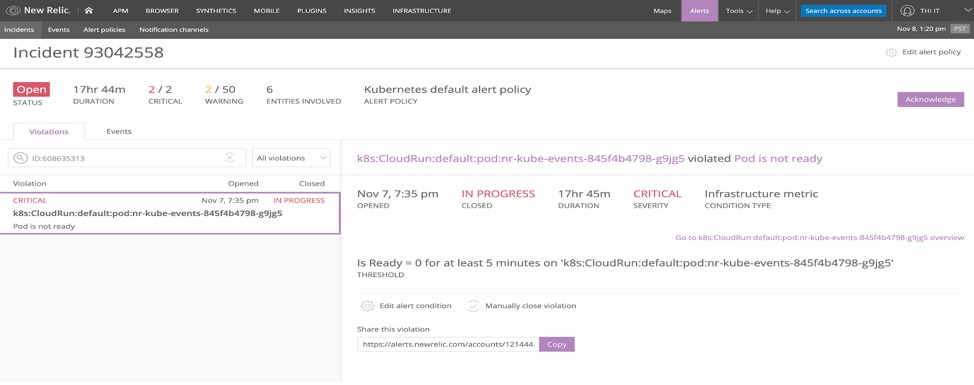
When deploying the New Relic Kubernetes integration for the first time in an account, a default set of alert conditions is deployed to the account. The alert policy is configured without a notification channel to avoid unwanted notifications.
You can customize alert condition thresholds to suit your environment and update the alert policy to send appropriate notifications, as shown in the screen shot below. For more information, see the Infrastructure alerts documentation:
New Relic and Google Cloud: Taking the mystery (and complexity) out of Kubernetes
New Relic provides out-of-box visualization and curated dashboarding experience to monitor your Anthos and Cloud Run deployments across clouds and demystifies the complexity of enterprise Kubernetes deployments. We're excited to be partnering with Google Cloud to help customers modernize infrastructure and applications, and to help them accelerate their cloud journeys.
Get started with New Relic today: request a demo or start your free trial by visiting www.newrelic.com. You can also explore these and other capabilities--hands-on and completely free of charge—with the early access release of our new Developer Edition. Visit developer.newrelic.com for details.
The views expressed on this blog are those of the author and do not necessarily reflect the views of New Relic. Any solutions offered by the author are environment-specific and not part of the commercial solutions or support offered by New Relic. Please join us exclusively at the Explorers Hub (discuss.newrelic.com) for questions and support related to this blog post. This blog may contain links to content on third-party sites. By providing such links, New Relic does not adopt, guarantee, approve or endorse the information, views or products available on such sites.

