Cerner Corporation, one of the leading healthcare IT companies in the world, employs more than 27,000 people and has a large engineering workforce. The engineering teams support a wide range of products, from electronic medical records, to data aggregation and analysis tools, to device integrations for smart devices and smart rooms. With this breadth of products, Cerner offers hosting on both public and private cloud infrastructure.
Since 1979, Cerner has worked at the intersection of healthcare and information technology. Over time, Cerner has continually evolved systems and innovated. Observability is critical in understanding these systems and ensuring continued learning from how they are used and performing in production.
As a principal engineer at Cerner Corporation, I focus on evolving and scaling the service infrastructure for Cerner's core electronic medical record platform, Millennium. When we build new solutions, we look for how we can effectively scale in building out systems. As I noted in a recent article for InfoQ, we have worked to consolidate our container build process so that it is easy to continue to advance common elements (like the New Relic agent and configuration) across all containers participating in the build.
These services are then all built and deployed in the same way through Spinnaker into our Kubernetes environments. This allows us to standardize how each service gets instrumented with New Relic and how we can keep them current. Over time we have found that New Relic’s developer ecosystem provides us with the tools we need to instrument both our new and even our legacy workloads and helps us to eliminate toil, providing a consistent way to observe our workloads.
Evolving technology with observability
With our history of technology, we continue to advance components of our systems. For example, we have native C++ service workloads that have a long, rich history in one of our systems. We have evolved this workload to leverage our newer deployment model on Kubernetes. Using the New Relic C SDK, we’re able to get effective telemetry data for these traditional workloads. Even something as simple as seeing what SQL queries are correlated to a single transaction is extremely valuable. While we could have continued to leverage previous instrumentation tooling with these workloads, we were able to advance its instrumentation as we modernized its delivery, producing a more unified observability platform.
We have some of our more traditional technologies coexisting with our more modern workloads, all of which are presented in a consistent set of telemetry data in New Relic. This reduces that operational cognitive load by avoiding unnecessary differences in instrumentation. If you have one place to look and get correlation between these systems, this quickly improves your understanding of how they are operating. Furthermore, you can get common advancements on the intelligence that is derived from this telemetry data that you may miss if these technology differences are further siloing your instrumentation.
Eliminating toil
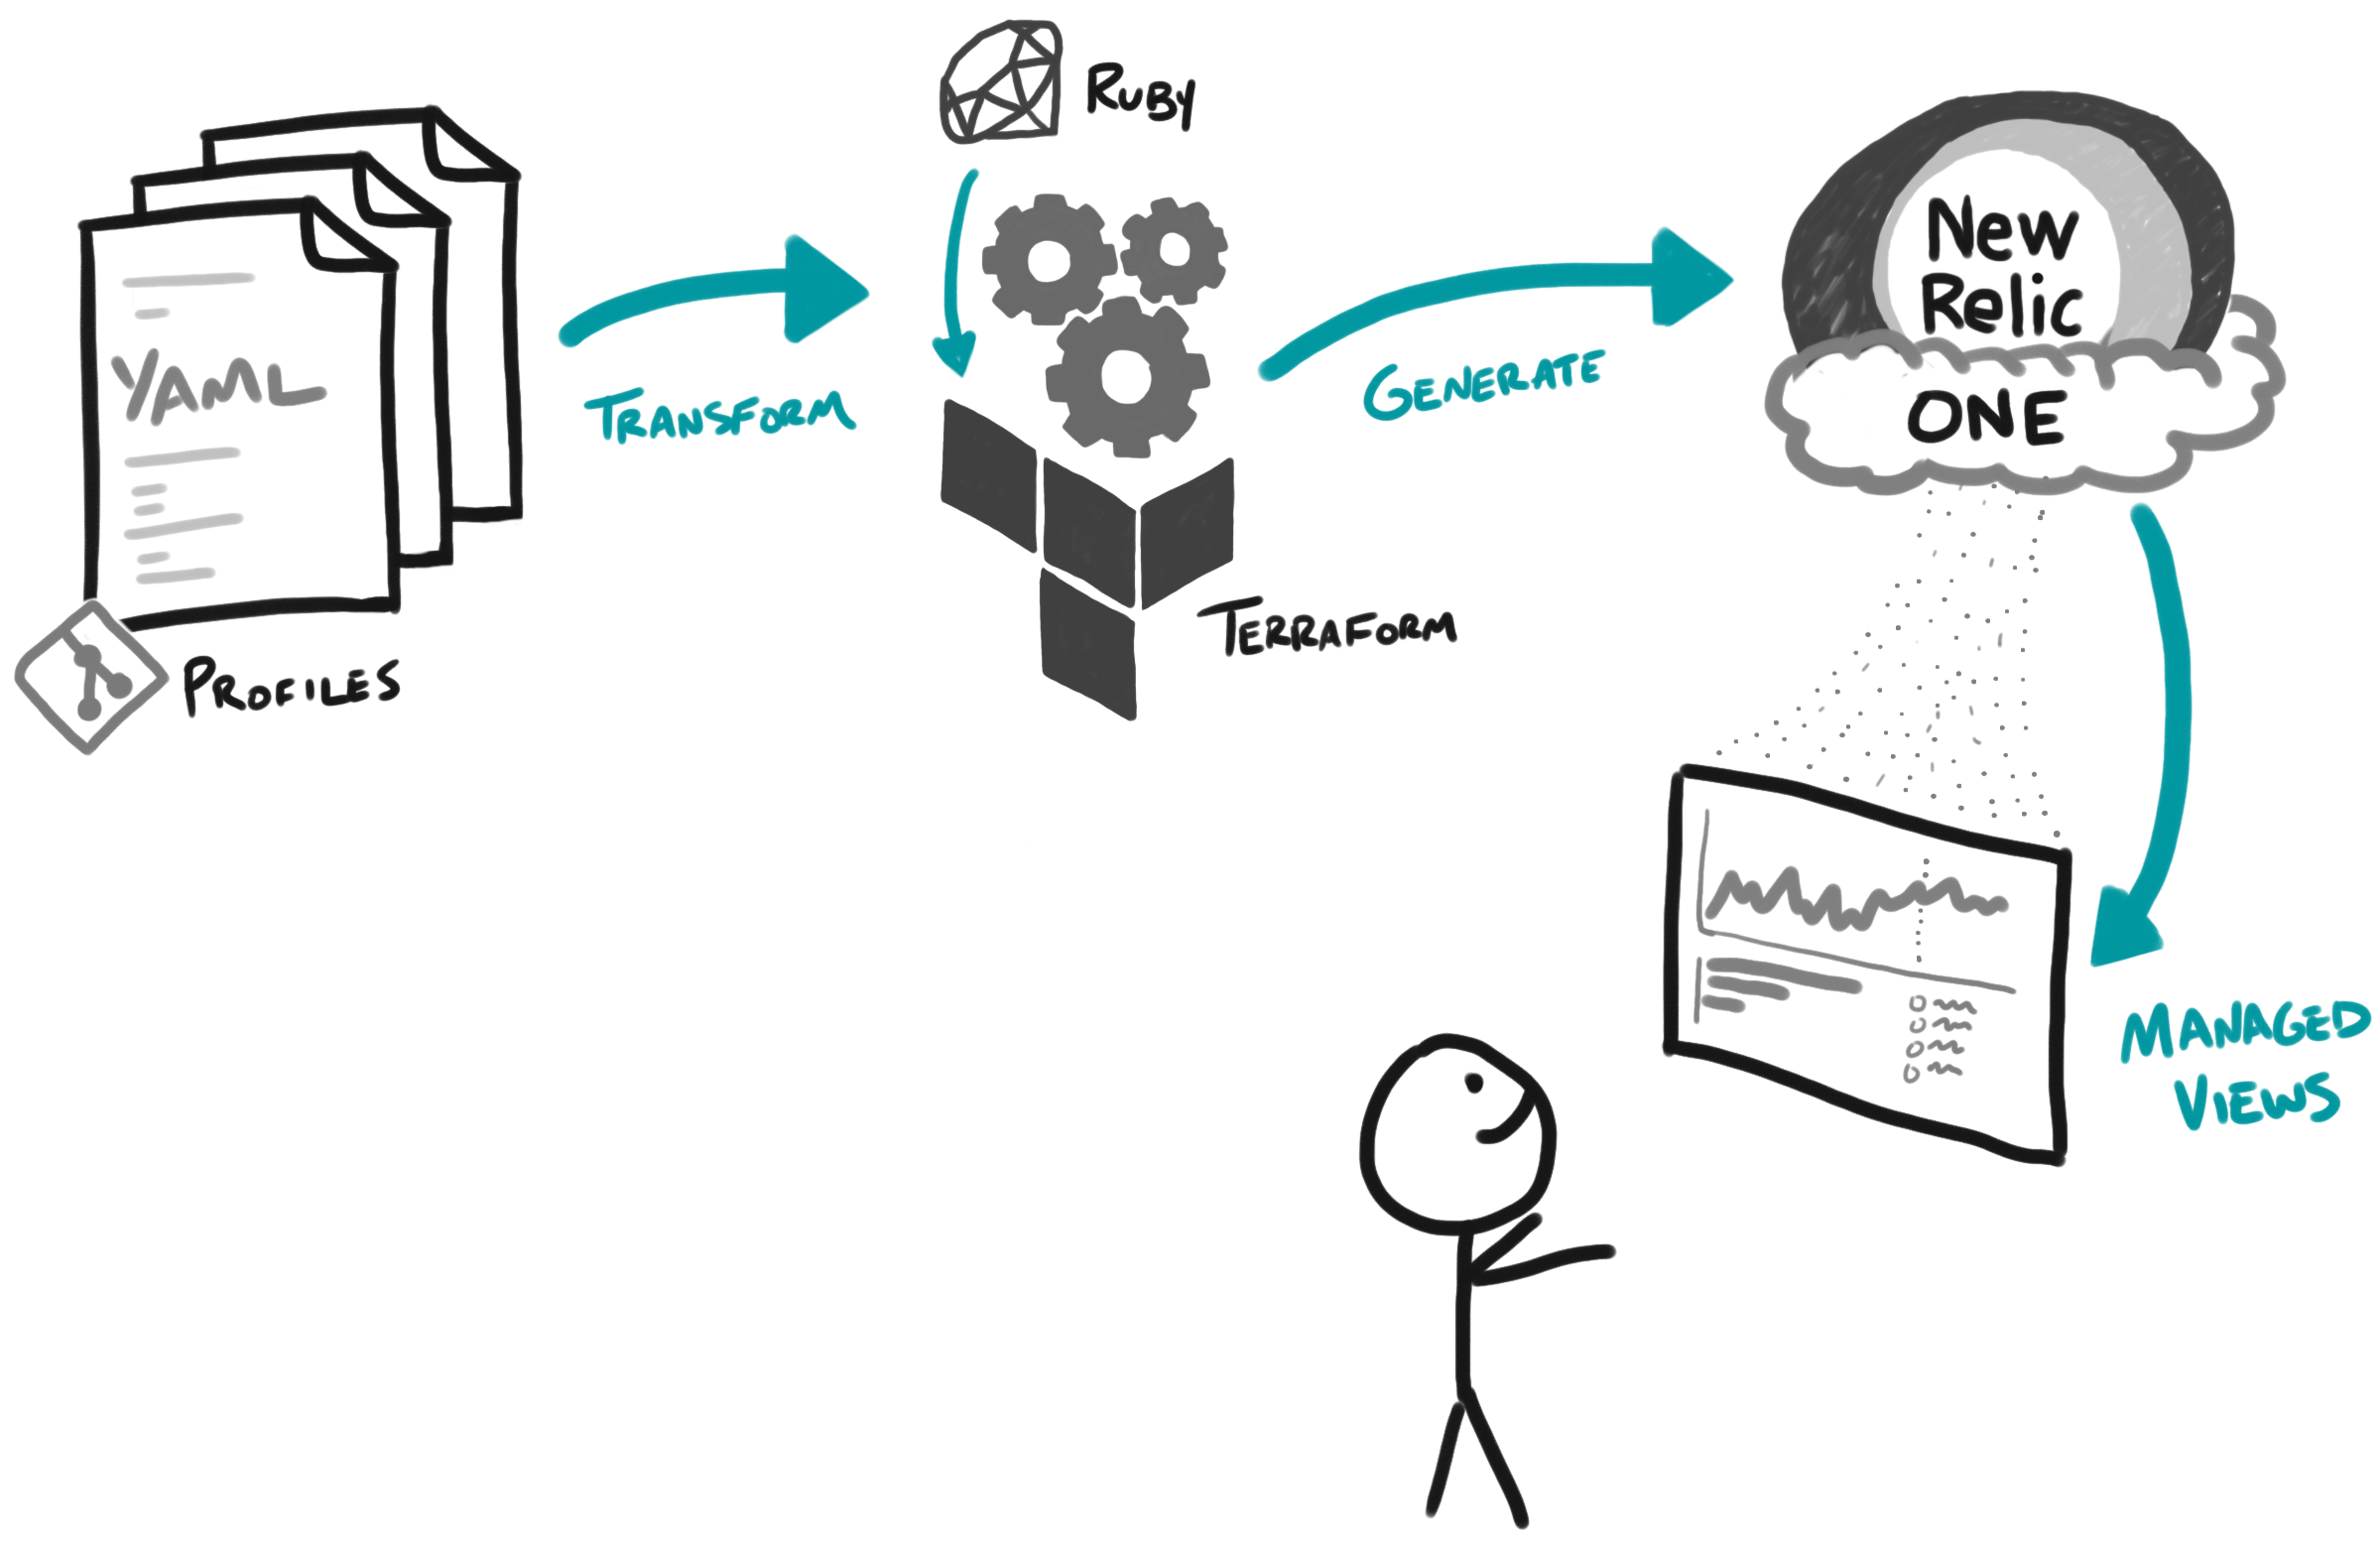
To help support our standard container build of services, we manage a declarative specification of our services that we call service profiles. These are just a common YAML specification that our tooling leverages, but helps normalize all the common facts that we use to build these services. Often when someone was investigating how a service was performing in New Relic, they were also looking up its service profile in GitHub. We found this unnecessary, as this was something that we could easily bake into their view in New Relic, so data is in context during their investigation.

Within New Relic, we built our own application that leverages the New Relic One GitHub Integration to show version control information about the application.
We’ve further customized that Nerdpack to expose the profile information derived from the aforementioned YAML specification. This information includes other related systems that we use, offering links that are pre-defined queries that run against a third-party log collection tool for the service. We also include links to the application in Spinnaker and to the engineers who own the service. In addition, because we have that information about the service owners in this standard YAML specification, we can auto-generate New Relic alerts and dashboards for them using the New Relic Terraform Provider. This allows us to centrally improve how these are offered.
Driving adoption
The combined effect of all of this work has given Cerner’s engineering teams a “paved path” that significantly reduces both the burden of adopting New Relic for observability and the operational toil of running our services. That said, as with any large engineering organization, we do still face challenges around the latter.
One technique we’ve found to be effective to help deal with this is to use our quarterly 24-hour hackathons, which we call “ShipIt Days.” During one of these events, we specifically explored observability by using New Relic One programmability, which is the ability to build custom visualization on New Relic One. This gave us the opportunity to have an in-depth period to learn more about New Relic One and how to make use of it. During the hackathon, one team built an interesting service-level objective (SLO) application that interrogates the service profile, extracts the target business metrics that are annotated on APIs, and then compares that against how the service is performing using data from New Relic. While it was a proof of concept, it gave real insight into what’s possible with New Relic One and helped grow the awareness with the larger engineering community.
Finally, good documentation is essential. We have a central documentation repository built using GitHub Pages. That documentation includes our “New Relic Handbook,” which is essentially an FAQ for any questions about how to use the platform. The handbook covers everything from basic topics such as which HTTP parameters to use, to more complex issues such as safely instrumenting applications with sensitive information. The handbook is treated as a living document, so every time something new is encountered, we ensure that it is captured and added to the guide.
Conclusion
As we continue our observability journey, we’re excited to continue to collaborate with New Relic. We’re continuing to adopt more automation and building apps using the resources from the New Relic teams we work with and from the developer guides on the New Relic developer portal.
If you are still early in your development of New Relic One applications, start with the developer portal, as there is a wealth of resources to accelerate your start.
The views expressed on this blog are those of the author and do not necessarily reflect the views of New Relic. Any solutions offered by the author are environment-specific and not part of the commercial solutions or support offered by New Relic. Please join us exclusively at the Explorers Hub (discuss.newrelic.com) for questions and support related to this blog post. This blog may contain links to content on third-party sites. By providing such links, New Relic does not adopt, guarantee, approve or endorse the information, views or products available on such sites.


