With more than 43 million vehicles viewed per month, Dealer.com's site performance and availability drives business for thousands of automobile dealerships across the country. If the site is not available or experiences an error and shoppers can’t quickly and seamlessly get a quote or do their preliminary research on a new car or truck, the sale might never happen.
In complex software environments like that at Dealer.com, each request typically makes its way through dozens of discrete services. A single problematic service along the path can affect the overall response time for that request, change a good customer experience into a bad one, and potentially cause customers to look elsewhere.
Software teams, working in an environment where there are many services involved in servicing a request, need to deeply understand the performance of every service, both upstream and downstream, so they can more effectively resolve performance issues, measure overall system health, and prioritize high-value areas for improvement.
New Relic distributed tracing is included for APM customers
New Relic distributed tracing is designed to give software teams working in modern environments an easy way to capture, visualize, and analyze traces through complex architectures. And if you’re already using New Relic application performance monitoring (APM), you get distributed tracing at no extra charge. You just need to update your agents, open New Relic, and select Traces to see your trace data.
New Relic APM agents completely remove the operational burden of managing complex tracing software, so engineers like Andrew at Dealer.com are free to instrument their environments to generate unlimited trace telemetry without worrying about the complexities associated with deploying and scaling components.
We’ve found New Relic’s distributed tracing to be super easy to integrate with. We simply updated our agent, and all of a sudden we had distributed tracing. It was a great experience.
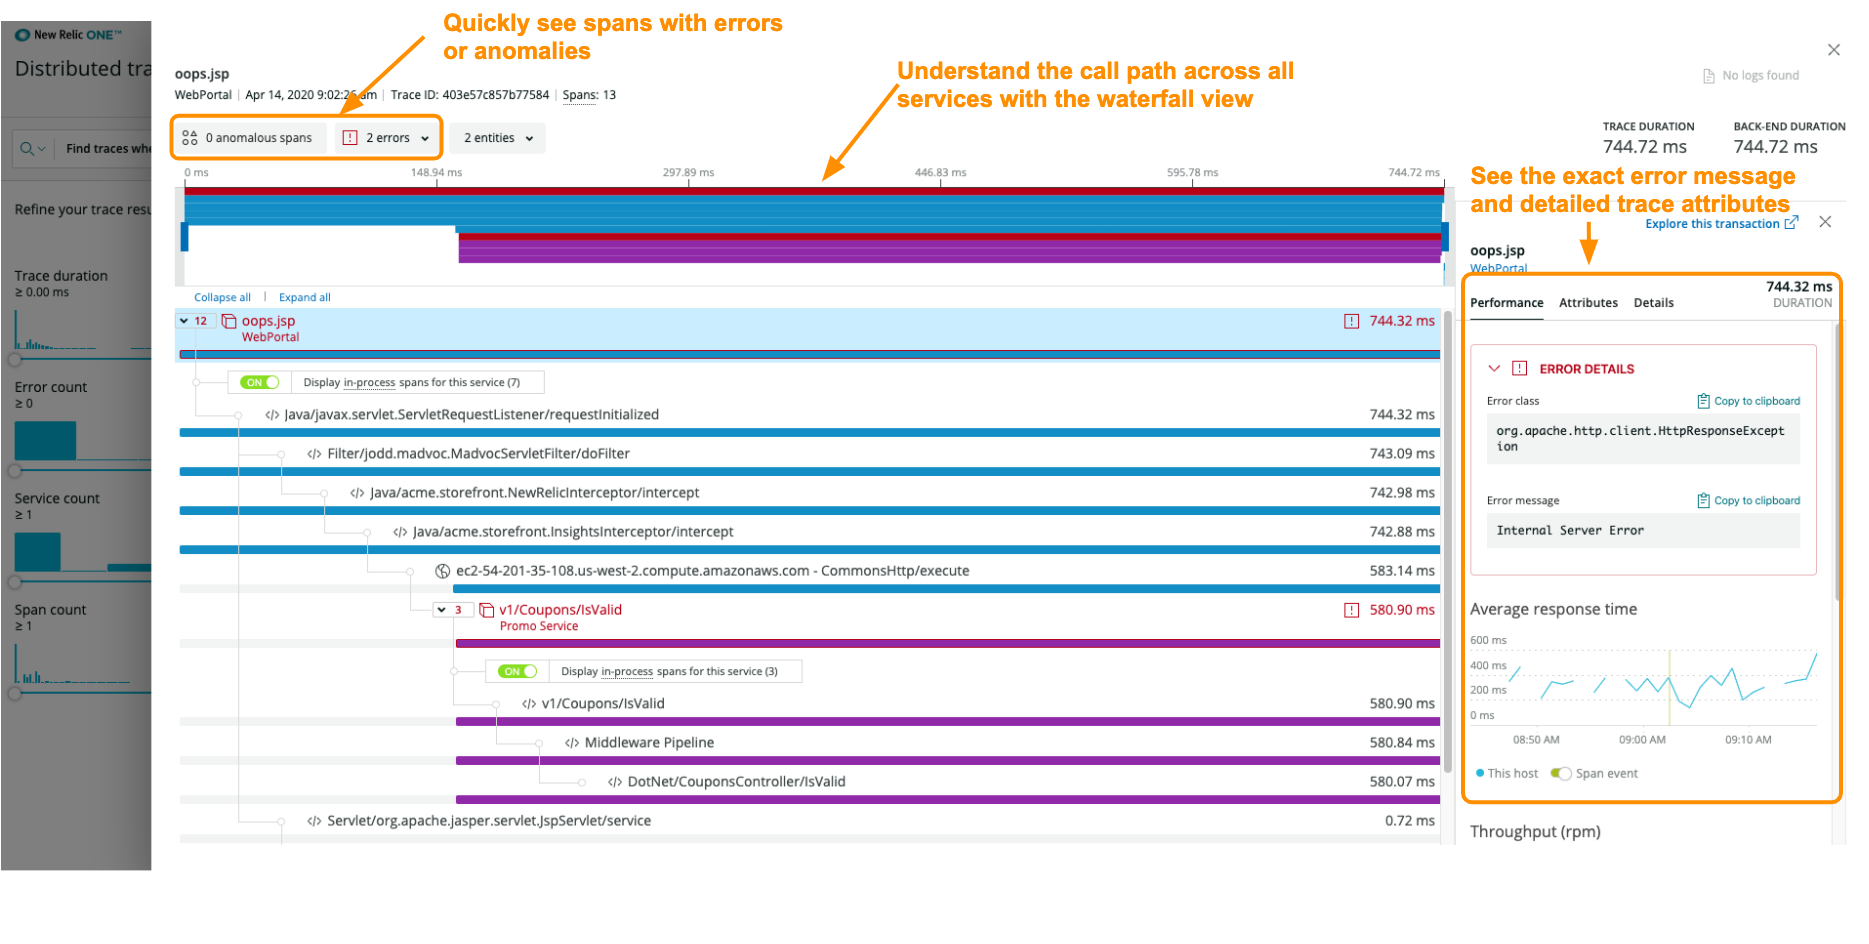
You can observe all application traces across your distributed systems automatically. New Relic distributed tracing provides actionable detailed scatter chart and waterfall visualizations for a variety of language frameworks like C, Go, Java, .NET, Node.js, PHP, Python, Ruby and more. It also includes New Relic browser data and mobile monitoring, AWS Lambda, and Zipkin format traces through the Trace API and supports common standards for traces like OpenTelemetry and W3C, so you can investigate and solve issues faster.
The distributed tracing view, part of New Relic application performance monitoring.
Understanding software complexity
To understand why distributed tracing is so important, it’s helpful to look at the cloud platforms, containerization, and container orchestration that forward-thinking software organizations use to quickly build, scale, and operate business-critical applications.
Despite the many advantages of software architectures built on microservices and serverless, the exploding number of components and their diversity in language, operating environment, and ownership creates a huge new burden for teams trying to manage them. Teams can’t effectively work toward resolving issues in a complex system until they understand all the service dependencies and how the performance characteristics of dependent services impact their requests and transactions. To find the proverbial needle in the haystack, you need a complete view of the entire system.
Understanding how a downstream service “a few hops away” can create a critical bottleneck for a service is essential for fast problem resolution. Just as important, it also provides DevOps teams with insight on how to optimize their code. If you can’t determine when, why, and how an issue happens, small defects may continue to linger in production until a perfect storm of events aligns and the system breaks all at once. Distributed tracing provides a detailed view of individual requests so you can point out precisely what parts of the larger system are causing issues to optimize and solve issues faster.
Data vs insights
Distributed tracing provides end-to-end visibility by revealing service dependencies. You can consider it a way to record and visualize requests through complex, distributed systems. But collecting and visualizing tracing data can be labor-intensive and complex to implement, like deploying, managing, and scaling third-party gateways or satellites for data collection.
New Relic makes setting up distributed tracing easy with automatic instrumentation. Our auto-instrumenting application code uses language agents that work with hundreds of different libraries and frameworks across multiple languages. You deploy one agent, and New Relic APM instruments each service involved in the request, creates timings for operations within the service, and automatically adds important troubleshooting information to each span. You can even add custom attributes to transactions and see all your information in the trace as well, without changing anything.
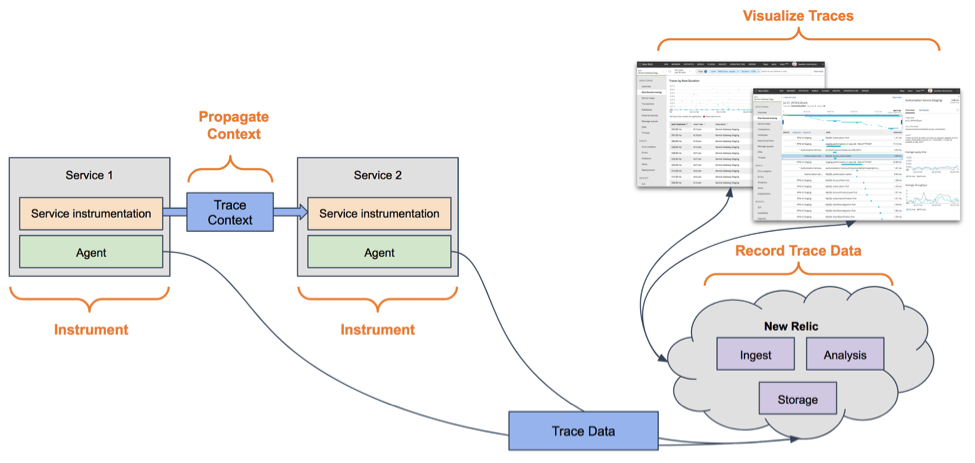
New Relic APM agents automatically create a unique trace ID for each incoming request and propagate that ID and other necessary correlation information as the “trace context” across the entire call. For example, when one service makes a call to another service, New Relic adds the trace context to the HTTP request header for the next service to use. Our auto-instrumentation is designed to eliminate the hard work of managing and propagating context.
What if you are using a transport that requires manual instrumentation? The New Relic APM agent provides an API that you can use to inject and extract the trace context. Using the W3C Trace Context format for propagating the trace context makes them interoperable with any other tracing agent or tool that also supports that standard.
None of this matters if you can’t identify the insights in the data across your stack. New Relic APM provides trace visualizations designed to help you quickly understand why a specific request is slow, where an error originated, and where you can optimize your code to improve the experience for your customers.
Here’s a diagram that shows how these components work together for New Relic distributed tracing:
Get started with New Relic distributed tracing
Ready to get started and identify ways to improve your applications? With New Relic APM and distributed tracing, soon you’ll be analyzing complex architectures so you can better understand dependencies across your system.
1. Review the distributed tracing documentation.
2. Deploy or update to the latest APM agent to each service involved in the call path you’re interested in. Distributed tracing will be immediately available upon upgrading.
- Deploy the latest Browser agent.
- Deploy the latest Mobile agent.
3. That's it! Now you can access the distributed tracing information from New Relic APM and quickly identify slow traces and traces with errors. And you can even use the advanced filtering to find traces by a combination of attributes.
Want to know more?
Distributed tracing is free for all New Relic APM customers in the Pro or Enterprise edition. Using distributed tracing makes it easy to optimize your code to improve the experience for your customers.
Find out more about how distributed tracing works in the technical details for distributed tracing.

The views expressed on this blog are those of the author and do not necessarily reflect the views of New Relic. Any solutions offered by the author are environment-specific and not part of the commercial solutions or support offered by New Relic. Please join us exclusively at the Explorers Hub (discuss.newrelic.com) for questions and support related to this blog post. This blog may contain links to content on third-party sites. By providing such links, New Relic does not adopt, guarantee, approve or endorse the information, views or products available on such sites.
This post contains “forward-looking” statements, as that term is defined under the federal securities laws, including but not limited to future roadmap for distributed tracing as well as the benefits of such features. The achievement or success of the matters covered by such forward-looking statements are based on New Relic’s current assumptions, expectations, and beliefs and are subject to substantial risks, uncertainties, assumptions, and changes in circumstances that may cause New Relic’s actual results, performance, or achievements to differ materially from those expressed or implied in any forward-looking statement. Further information on factors that could affect New Relic’s financial and other results and the forward-looking statements in this press release / post is included in the filings New Relic makes with the SEC from time to time, including in New Relic’s most recent Form 10-K, particularly under the captions “Risk Factors” and “Management’s Discussion and Analysis of Financial Condition and Results of Operations.” Copies of these documents may be obtained by visiting New Relic’s Investor Relations website at http://ir.newrelic.com or the SEC's website at www.sec.gov. New Relic assumes no obligation and does not intend to update these forward-looking statements, except as required by law.


