/ 
Logs Analysis Dashboard

Logs Analysis Dashboard

Logs analysis dashboard allows you to get deep visibility into the ingestion of your logs.

What's included?

dashboards
1
Logs Analysis Dashboard quickstart contains 1 dashboard. These interactive visualizations let you easily explore your data, understand context, and resolve problems faster.
documentation
1
Logs Analysis Dashboard observability quickstart contains 1 documentation reference. This is how you'll get your data into New Relic.
alerts
0
This quickstart doesn't include any alerts. Do you think it should?
You can edit this quickstart to add helpful components. View the repository and open a pull request.
View repo View repo

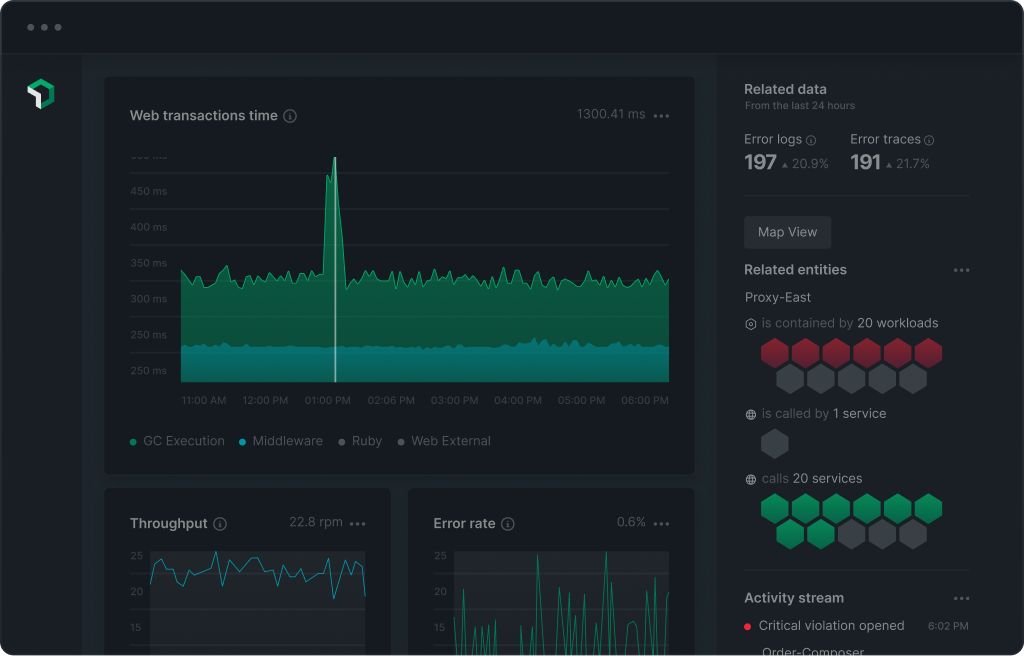
The logs analysis dashboard allows you to get deep visibility into the ingestion of your logs. With this panel, you will be able to identify the services and host that send the most logs, which types of serverity are being sent, the cost for each of the attributes and also if the essential attributes are being sent for the ccorrelation between services and logs, such as: service name, log in context and hostname.

How to use this quickstart

  • Sign Up for a free New Relic account or Log In to your existing account.
  • Click the install button.
  • Install the quickstart to get started or improve how you monitor your environment. They're filled with pre-built resources like dashboards, instrumentation, and alerts.
Authors
Thiago Anate
Support
BUILT BY NEW RELIC
Need help? Visit our Support Center or check out our community forum, the Explorers Hub.