What's included?
dashboards
1
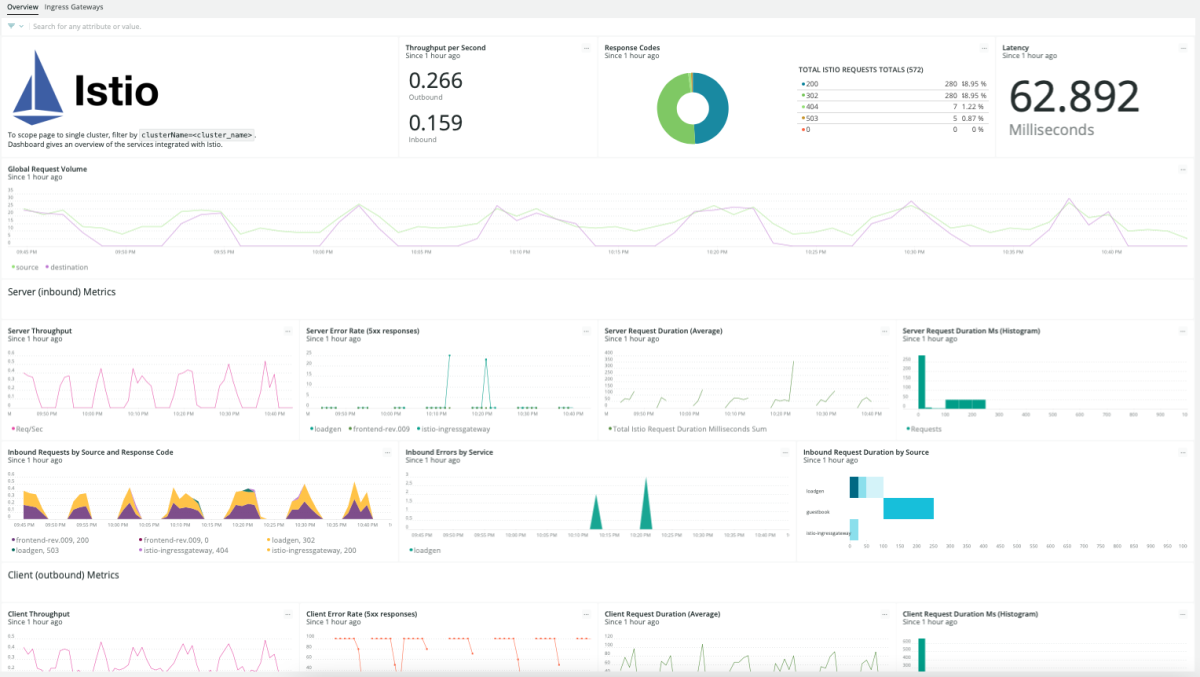
Istio Service quickstart contains 1 dashboard. These interactive visualizations let you easily explore your data, understand context, and resolve problems faster.
Istio Service
alerts
1
Istio Service observability quickstart contains 1 alert. These alerts detect changes in key performance metrics. Integrate these alerts with your favorite tools (like Slack, PagerDuty, etc.) and New Relic will let you know when something needs your attention.
Response Code 5xx for over 5 minutes
If the `reporter = 'destination'` reports response code '5xx' over 100 times in five minutes then
issue a 'Critical' alert.
issue a 'Critical' alert.
documentation
2
Istio Service observability quickstart contains 2 documentation reference. This is how you'll get your data into New Relic.
This dashboard will give you insight into services and applications running in Kubernetes clusters with an Istio Service Mesh enabled. Includes client/server focused service metrics, and an additional page for displaying Ingress Gateway metrics.
The only requirement for installing this along with the New Relic Kubernetes agent is the Prometheus OpenMetrics Integration. POMI


