/ 
Cisco IP SLA Operations

Cisco IP SLA Operations

Easily install a curated dashboard and example alerts to monitor the health of your Cisco IP SLA Operations with New Relic's Network Monitoring.

What's included?

dashboards
1
Cisco IP SLA Operations quickstart contains 1 dashboard. These interactive visualizations let you easily explore your data, understand context, and resolve problems faster.
alerts
1
Cisco IP SLA Operations observability quickstart contains 1 alert. These alerts detect changes in key performance metrics. Integrate these alerts with your favorite tools (like Slack, PagerDuty, etc.) and New Relic will let you know when something needs your attention.
Cisco IP SLA Operation Status
This alert monitors the status of all active Cisco IP SLA Operations and will trigger when the latest sense code for a single operation is not equal to 'ok' for at least 60 seconds.
documentation
1
Cisco IP SLA Operations observability quickstart contains 1 documentation reference. This is how you'll get your data into New Relic.

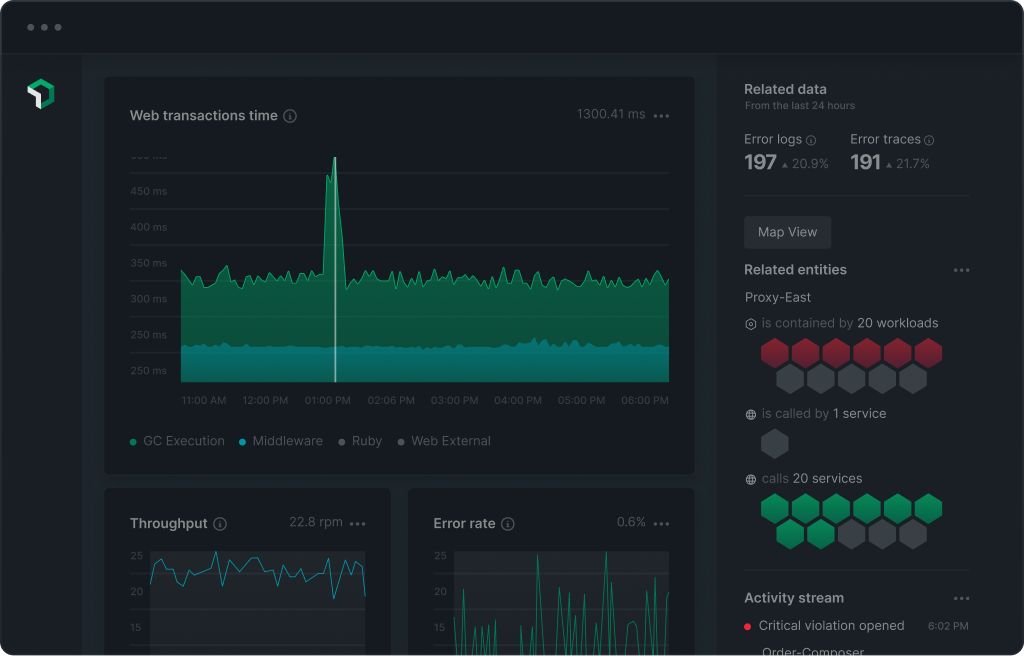
The Cisco IP SLA Operations quickstart provides a dashboard that gives you a holistic view of your configured IP SLA operations in your Cisco ecosystem, as well as example alerts to get you started. Use this quickstart together with New Relic's Network Monitoring feature to visualize anomalies and/or bottlenecks in your network.

How to use this quickstart

  • Sign Up for a free New Relic account or Log In to your existing account.
  • Click the install button.
  • Install the quickstart to get started or improve how you monitor your environment. They're filled with pre-built resources like dashboards, instrumentation, and alerts.
Authors
New Relic
Marc Netterfield
Zack Mutchler
Support
BUILT BY VERIFIED
Need help? Visit our Support Center or check out our community forum, the Explorers Hub.