What's included?
dashboards
2
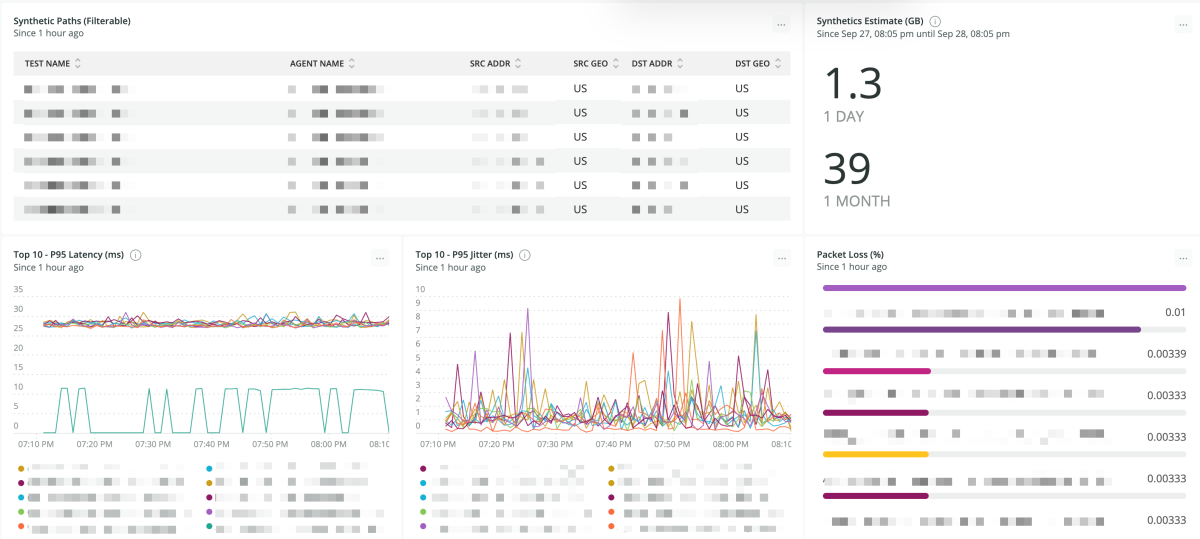
Kentik Firehose quickstart contains 2 dashboards. These interactive visualizations let you easily explore your data, understand context, and resolve problems faster.
Kentik Synthetics
Kentik Firehose
alerts
3
Kentik Firehose observability quickstart contains 3 alerts. These alerts detect changes in key performance metrics. Integrate these alerts with your favorite tools (like Slack, PagerDuty, etc.) and New Relic will let you know when something needs your attention.
Network Synthetic Jitter
This alert will trigger when a Kentik network synthetic test has average jitter above 250 ms for 600 seconds. This is an indication of a very unreliable network path.
Network Synthetic Latency
This alert will trigger when a Kentik network synthetic test has average latency above 1000 ms for 600 seconds. This is an indication of a very slow network path.
Network Synthetic Loss Percent
This alert will trigger when a Kentik network synthetic test has average loss above 5 % for 600 seconds. This is an indication of a very unreliable network path.
documentation
1
Kentik Firehose observability quickstart contains 1 documentation reference. This is how you'll get your data into New Relic.
This quickstart gives you visibility into data ingested via the Kentik Firehose. The data is sent to Kentik and enriched before being sent to New Relic. Deploying this quickstart gives insights into Network Flows, Network Synthetics, and performance telemetry associated with Kentik-monitored devices. Includes example alerts to get you started. For more information or support, please go to https://www.kentik.com/customer-care/