/ 
Mule ESB

Mule ESB

Monitor Mule ESB with New Relic's Java agent

What's included?

dashboards
1
Mule ESB quickstart contains 1 dashboard. These interactive visualizations let you easily explore your data, understand context, and resolve problems faster.
alerts
2
Mule ESB observability quickstart contains 2 alerts. These alerts detect changes in key performance metrics. Integrate these alerts with your favorite tools (like Slack, PagerDuty, etc.) and New Relic will let you know when something needs your attention.
High CPU Utilization
This alert is triggered when the CPU Utilization is above 90%.
Transaction Errors
This alert is triggered when the the transactions fail more than 10% of the time in 5 minutes.
documentation
1
Mule ESB observability quickstart contains 1 documentation reference. This is how you'll get your data into New Relic.

What is Mule ESB?

Mule is a lightweight Java-based enterprise service bus (ESB) and integration platform.

Get started!

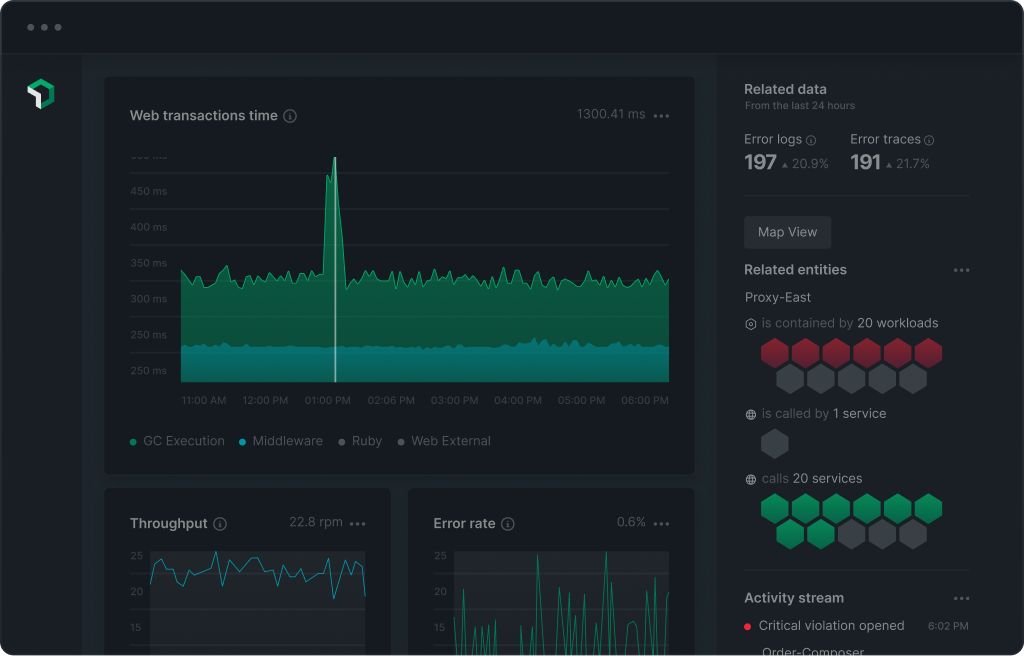
Leverage community expertise and instantly get value out of your telemetry data. This quickstart automatically instruments Mule ESB with the New Relic Java agent, and allows you to instantly monitor your Java application with out-of-the-box dashboards and alerts. Further leverage New Relic's APM capabilities by setting up errors inbox, transaction tracing, and service maps.

More info

Check out the documentation to learn more about New Relic monitoring for Mule ESB. To learn more about Mulesoft, visit their blog.

How to use this quickstart

  • Sign Up for a free New Relic account or Log In to your existing account.
  • Click the install button.
  • Install the quickstart to get started or improve how you monitor your environment. They're filled with pre-built resources like dashboards, instrumentation, and alerts.
Authors
New Relic
Support
BUILT BY NEW RELIC
Need help? Visit our Support Center or check out our community forum, the Explorers Hub.