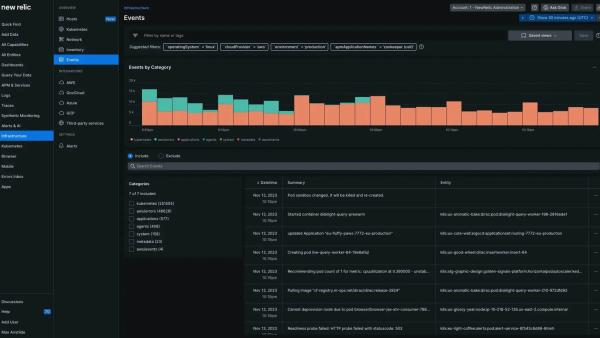
Today we’re introducing the industry’s only full-stack change tracking solution, now available to every New Relic full platform user at no additional cost.
Change tracking gives engineering teams complete visibility into both deployments and change events, across their entire stack. With context from any source, for any event type, engineers can fix issues fast and improve deployment velocity and reliability.
A large number of IT outages happen because of a code or configuration change of some kind. According to Gartner, outages on average cause ~$300K in revenue loss per hour, so organizations need a solution to manage risk and avoid severe business impact. Current tools don’t allow you to correlate deployment data in context with software performance metrics and only provide static time-series graphs. The result? You're running unaware, switching between tools, or chasing the wrong end of the stick, delaying resolution.
Enter change tracking! New Relic change tracking ties deployments and other changes to performance data so you can troubleshoot and resolve incidents faster with errors, logs, and traces in context.
See how it’s done:
With change events now captured in context with the rest of your telemetry data, you can finally understand the full scope and impact of those changes, allowing you to implement CI/CD best practices that dramatically reduce triage and incident resolution time while driving faster, more reliable delivery pipelines. You can correlate system performance with change events and details such as metadata, timestamps, descriptions, version numbers, links to changelogs and CI/CD tools, embedded into charts and tables across the New Relic platform.
Without hassle, you can automatically share changes in context with key observability metrics via our brand new GraphQL API, New Relic CLI, and CI/CD tools (Jenkins, GitHub, CircleCI, JFrog, etc.)
If you can’t wait and you’re ready to jump into change tracking now, check out our documentation or sign up and get started.
At 10x Banking, we believe technology can deliver fundamental transformation in banking. We created 10x to build better banks—banks that put the customer at the center of all they do—and rely on innovative technologies like New Relic to help us do that. With New Relic, we deploy code quickly with confidence. New Relic change tracking allows us to track all deployments across our services to find spikes in error rate and troubleshoot with logs in context for change-related incidents.
Monitor changes and deployments
Track any change—from deployments to configuration changes to business events— across the entire New Relic ecosystem. Engineering teams can determine the kinds of change they most care about and track the success of these changes against software performance. A detailed comparison view shows whether changes are making your system more or less reliable over time and gives you the context needed to fix problems. Change tracking allows engineers to identify the root cause of change-related incidents and remediate issues in real time with less confusion and stress.
Connected CI/CD toolchains
Automatically mark charts with change details and metadata, and record deployments to NRDB from any source with a brand new GraphQL API, New Relic CLI, and plugins with Jenkins, Github Actions, JFrog, and CircleCI. Ingest deployment and change event metadata alongside all telemetry data, share context, and automate the process in your team’s deploy scripts and CI/CD processes. Engineers want CI/CD automation and real-time change context to consistently drive faster, more reliable deployments. Change tracking instantly illuminates why a deployment happened, what that deployment was, how it affects other systems, and more.
Universal access to change markers
See how changes impact software performance across the New Relic platform, including APM, browser, mobile, service levels, custom dashboards, and more. Cross-team, cross-platform access drives transparency around change context—allowing developers to glean the insights they need when troubleshooting. Being highly integrated across all of New Relic’s capabilities, change tracking allows teams to correlate similar incidents, identify change as a root cause, notify appropriate engineers, and collaborate in real-time to deploy a fix.
New change analysis interface
Interactive, clickable markers hover over performance charts, guiding you to a change analysis interface, helping engineers correlate a change’s effect over time with errors, logs, anomalies, incidents, and more. From this interface, your team can easily view deployments and other change events in context with deep links, CI/CD metadata, commit SHAs, related entities, and golden signals to initiate remediation tactics quickly and improve deployment velocity over time.
Fast context
Simply click on a change notification, determine why the change happened, triage the problem, roll it back, and kickstart a remediation tactic all within New Relic. With context, you can determine when a deployment caused an issue and how your team can implement a fix. You’ll see when a deployment occurs and know how it affects related systems, even if the deployment happened outside your team. As soon as an alert rings, you’ll instantly see the change on related performance charts, understand the impacts of that change, and know how to troubleshoot, triage, and resolve the incident.
With over 100 million members, we need to know when changes and deployments cause performance degradation and downtime for our customers. We have multiple independent teams deploying changes all the time, and New Relic change tracking has allowed us to see change in context with all of our golden signals and fix problems faster.
A template for change tracking
It’s important to understand that change tracking goes beyond deployments. It includes a broad set of changes such as configuration changes, business events, and more. To help you get started with the feature, we’ve created a template:
1. Build a deployment checklist.
As a DevOps engineer, release manager, SRE, or anyone else involved in a deployment, you can use a checklist to help you follow useful procedures and best practices throughout the deployment lifecycle. This checklist may include items such as the tracking of key performance metrics related to both your deployment and your overall system (e.g. latency, error rate, transactions, CPU utilization, and more). With change tracking, you can automatically see change events and deployments overlaid on top of key performance metrics, helping you improve CI/CD efficiency over time. Mapping out exactly what you need to do for every deployment can help you find opportunities for automation, driving a faster, more resilient CI/CD pipeline.
A typical deployment pipeline includes building, testing, merging code, releasing the code, and then deploying the change to production. You, or other engineers on the team, might format checklists by stage of the CI/CD pipeline: Build, Test, Merge, Release, and Deploy. This gives your team a basic structure to work around and then identify opportunities for automation and general improvement at each stage.
2. Use config and deploy tools.
It isn’t DevOps if we’re not talking about automation and tools! This step will vary depending on your cloud maturity or the type of service your team maintains, but CI/CD automation tools such as Jenkins, CircleCI, JFrog, GitHub Actions, and others will make your life so much easier. Change tracking, and our new GraphQL API integrated with your CI/CD tools, lets you mark up charts in New Relic at the same time you make a deployment, without the need for manual intervention. Then, when performance degradations or outages occur, you’ll see the change events in-line with the associated key metrics to understand what caused the problem.
CI/CD tools help you track everything from building to testing to final deployment. Purpose-built automation allows you to enhance the entire process without losing any of the context you need in a deployment pipeline. Additionally, by sending the metadata to New Relic, you can associate degradations to change events quickly, so that you can roll them back or deploy a hotfix as fast as possible. And going beyond deployments, configuration tools such as Ansible, Puppet, and Chef can glean even more context into other categories of configuration changes.
3. Automate and learn.
Automation augments human workflows and enhances CI/CD pipelines over time, and change tracking automatically shows changes in-context with errors, logs, and traces to improve incident response and remediation time. Some teams even conduct retrospectives on their deployments, such as post mortem incident reports, to learn and discover how they can reduce risk and increase deployment velocity. But, these opportunities for improvement only come when you collect change event details and surface them quickly to applicable teams. Change tracking allows teams to share context and improve their CI/CD pipelines from the planning stages all the way to production.
A checklist for every deployment is a great place to start, because it allows you to refine your checklist, build custom workflows, and add new tooling to make your CI/CD process even more efficient. CI/CD best practices depend on your ability to learn continuously and apply those lessons to your release management pipeline.
4. Connect change to performance.
Change is the only constant in a world of CI/CD, and the New Relic unified observability platform helps you turn data into insights, so you can deploy quickly and with confidence, knowing that when something goes wrong, you have the context needed to react decisively.
Consider this example: You deploy a change, and New Relic’s change tracking automatically correlates an affected database’s performance metrics with your deployment details, adding the relevant metadata directly to the database performance chart. Now, if your deployment causes that database’s ETL process to degrade, creating issues for other teams, those teams get full visibility into your deployment details right alongside their own performance metrics, giving them the context necessary to reach out to you to request a rollback.
In fact, your team could set up dashboards and reports in New Relic to track the speed and reliability of the deployment process, itself. How often is your team making deployments? How often does this deployment trigger an incident? You can define KPIs around your CI/CD process and release pipeline, track them over time, and discover ways to improve your toolchain and deployment workflow. Context is everything when it comes to monitoring change in your applications and services, but it’s even more effective when that context can be shared quickly, right where engineers are working.
Next steps
Change tracking is generally available to New Relic full platform users. Check out the change tracking documentation or log in to New Relic and try change tracking today. If you don’t have a New Relic account already, sign up for a free New Relic account. Your free account includes 100 GB/month of free data ingest, one free full-access user, and unlimited free basic users.
The views expressed on this blog are those of the author and do not necessarily reflect the views of New Relic. Any solutions offered by the author are environment-specific and not part of the commercial solutions or support offered by New Relic. Please join us exclusively at the Explorers Hub (discuss.newrelic.com) for questions and support related to this blog post. This blog may contain links to content on third-party sites. By providing such links, New Relic does not adopt, guarantee, approve or endorse the information, views or products available on such sites.


