Image
Quickstart
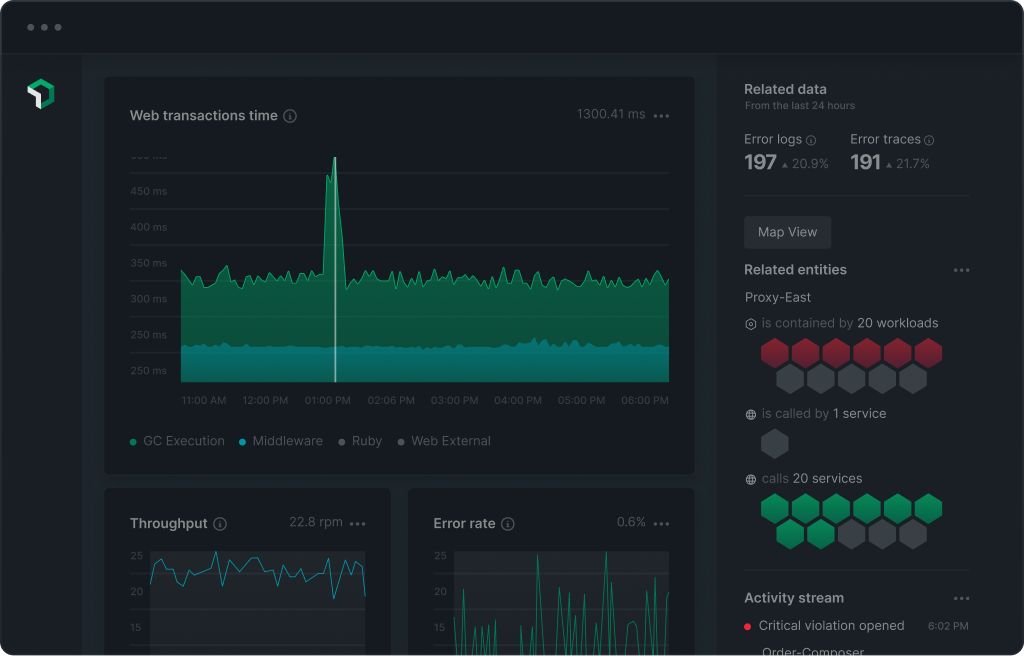
What is Synthetics monitoring?
Synthetic monitoring is a suite of automated, scriptable tools to monitor your websites, critical business transactions, and API endpoints. You can simulate user traffic to proactively detect and resolve outages and poor performance of critical endpoints before your customers notice.
What is a Synthetics Page Link CrawlerSynthetics Page Load performance monitors essentially are simple, pre-built scripted browser monitors. They make a request to your site using an instance of Google Chrome and wait for a full page load.
Compared to a simple ping monitor, this is a more accurate emulation of an actual customer visit. The user agent is identified as Google Chrome.
The check will return you detailed resource breakdowns and timelines to debug performance and latency issues.
Authors
Support
BUILT BY NEW RELIC
Need help? Visit our Support Center or check out our community forum, the Explorers Hub.
Need help? Visit our Support Center or check out our community forum, the Explorers Hub.