Image
Quickstart
What is MSMQ?
Microsoft Message Queueing is a messaging protocol that allows applications running on separate servers/processes to communicate.
Get started!
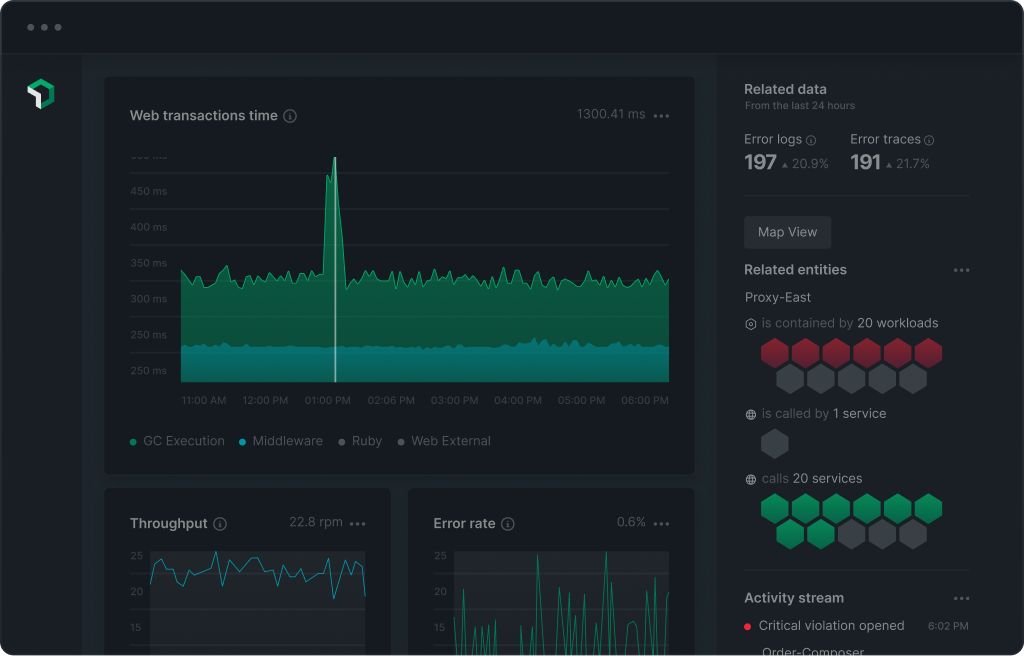
Leverage community expertise and instantly get value out of your telemetry data. This quickstart automatically instruments MSMQ with the New Relic .Net agent, and allows you to instantly monitor your .Net application with out-of-the-box dashboards and alerts. Further leverage New Relic's APM capabilities by setting up errors inbox, transaction tracing, and service maps.
More info
Check out the documentation to learn more about New Relic monitoring for MSMQ.
Authors
Support
BUILT BY NEW RELIC
Need help? Visit our Support Center or check out our community forum, the Explorers Hub.
Need help? Visit our Support Center or check out our community forum, the Explorers Hub.
Related resources