A central component of the New Relic One observability platform is an adherence to open instrumentation. Many open systems and frameworks for software development have built-in metrics, events, logs, and traces that they emit in common formats. For observability, you need to collect telemetry data from both open and proprietary sources, and combine it in one place.
Istio is a popular service mesh that lets you connect, monitor, and secure microservices deployed on-premise, in the cloud, or with orchestration platforms like Kubernetes. Istio is an excellent example of a system that emits useful telemetry data about its health and function. In fact, this was one of the primary reasons the New Relic Service Mesh team chose to build New Relic’s next-generation service mesh on the Istio platform.
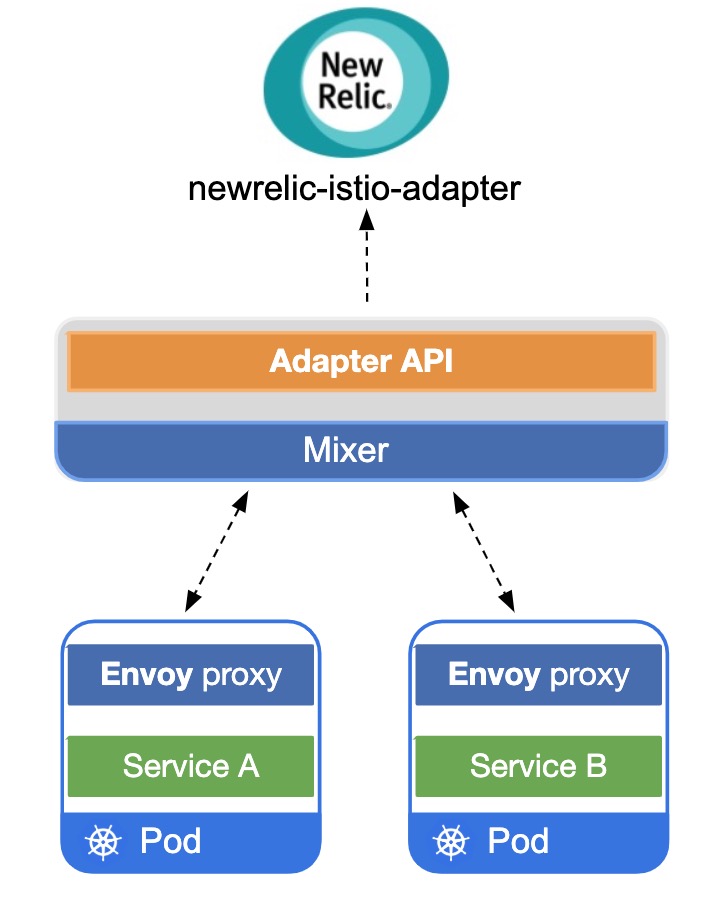
To run our mesh on Istio, we had to build an adapter to directly integrate with Istio's telemetry engine, Mixer. Our adapter leverages Mixer’s extensible architecture to send curated and customizable telemetry for any service-to-service communication within the service mesh to New Relic, all without the need of an agent.
Once we built the adapter, though, we knew we couldn’t keep it to ourselves. So, as part of our open instrumentation initiative, we open sourced the newrelic-istio-adapter, available now on GitHub.
Read on to learn more about how it works.
How the newrelic-istio-adapter works
We built the newrelic-istio-adapter using the new go-telemetry-sdk, an open source set of API client libraries that send your metric and trace data to the New Relic platform. Using the SDK we were able to integrate with Mixer to gather two types of telemetry data:
- Istio's metric telemetry to send that open source metric data to New Relic
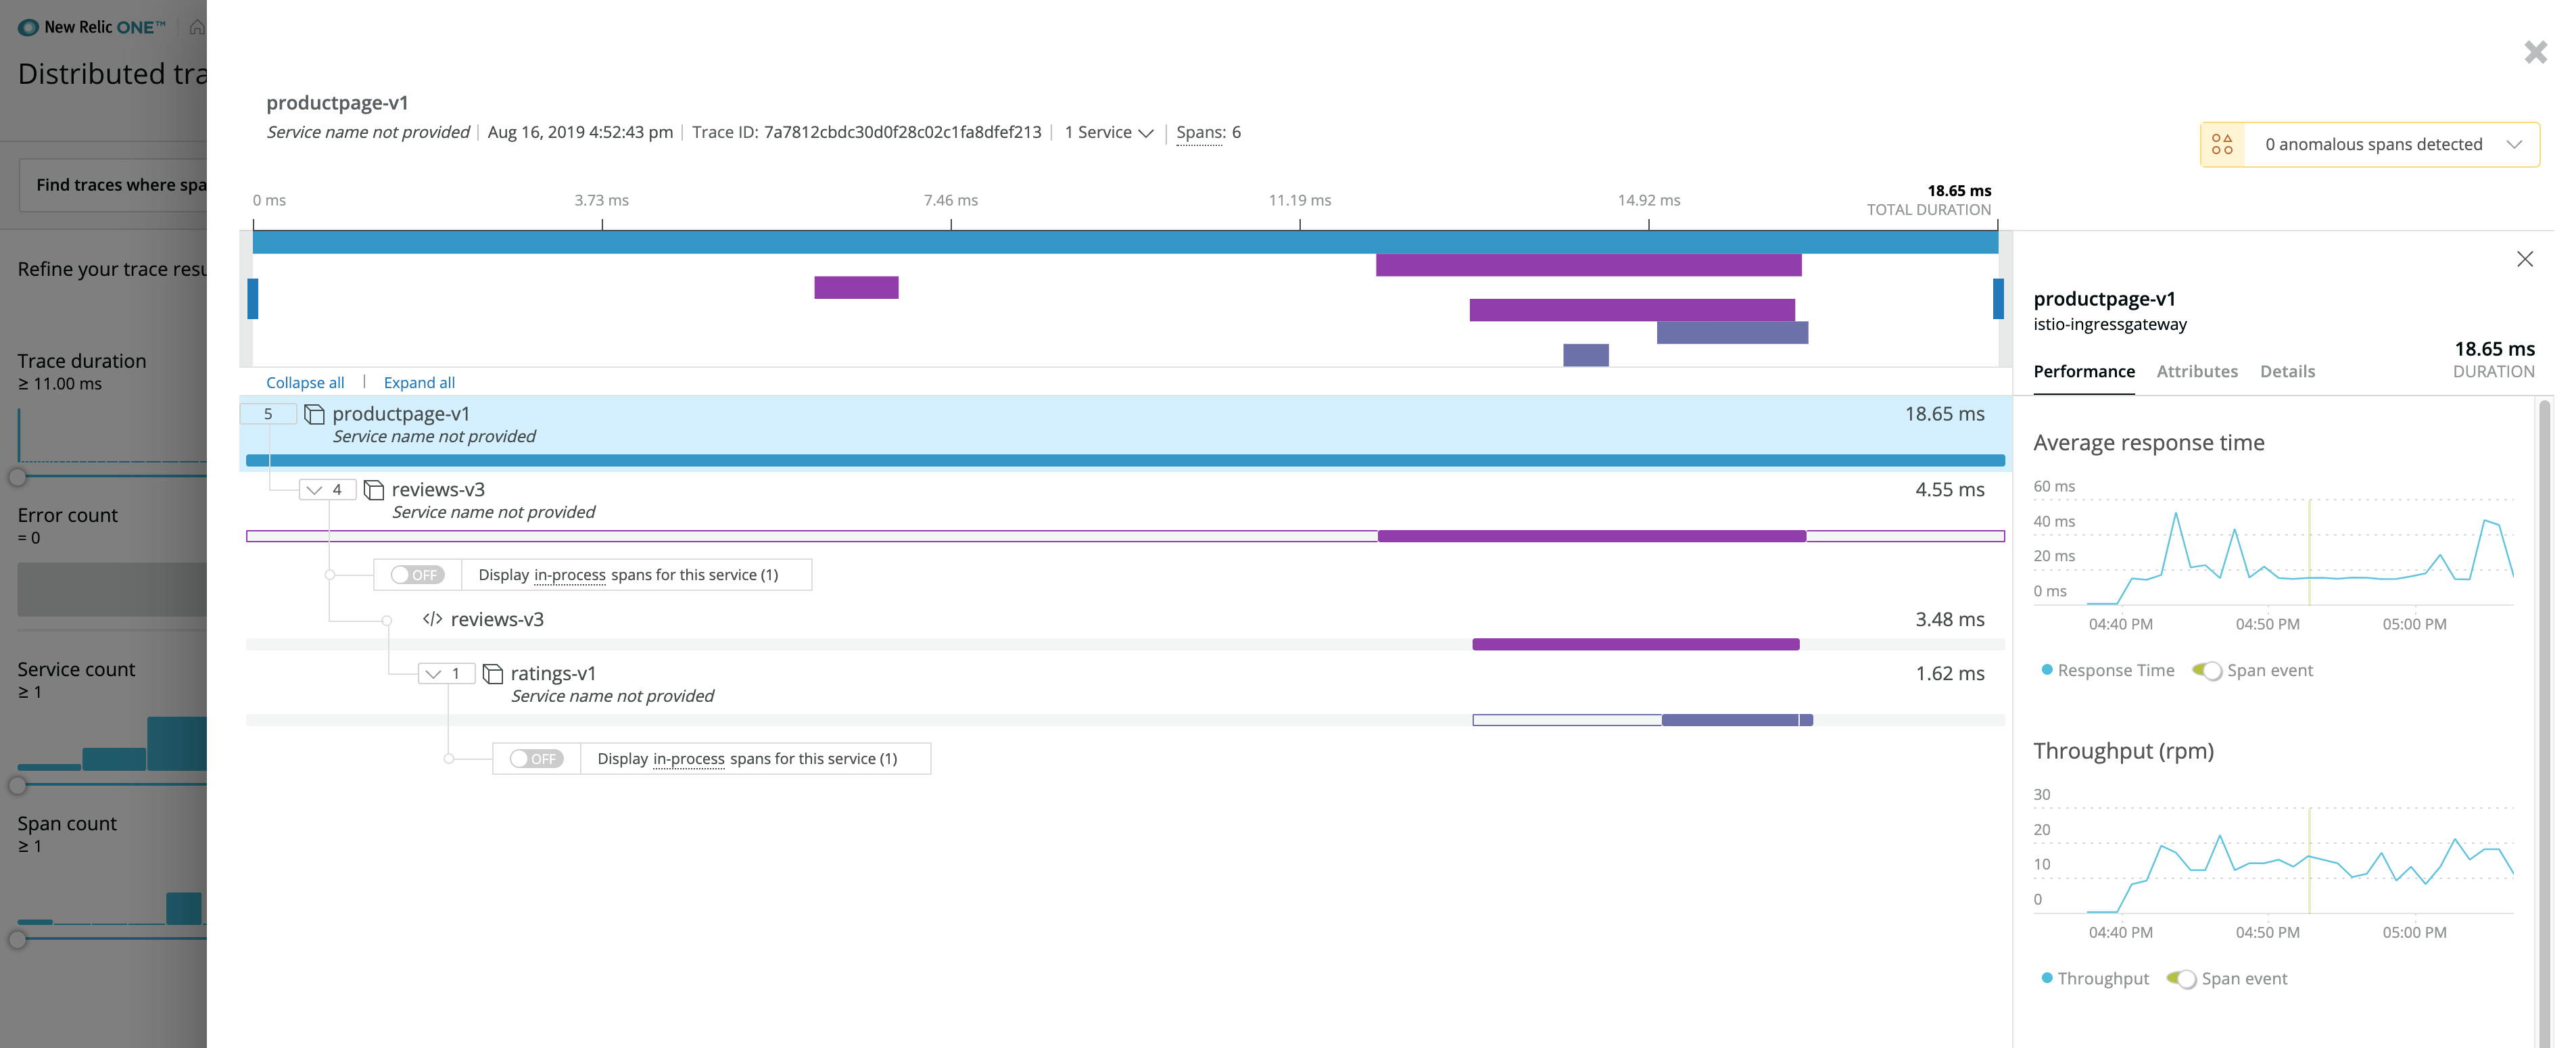
- Istio's trace telemetry to send spans of distributed traces traversing the service mesh to New Relic
The newrelic-istio-adapter sits alongside Istio in an isolated environment to ensure no interference with the core service mesh functionality of Istio. Once the adapter is up and running, you configure Mixer to send telemetry about events within the service mesh to the adapter. The adapter transforms and delivers this telemetry data as curated open source (multi-dimensional) metrics—essentially, metrics with multiple key-value pairs—to New Relic.

Istio metrics data
The ability to send open source dimensional metrics data to New Relic is a real game changer for any New Relic user. With a high volume of information-rich data, you can query and visualize that data with a high degree of resolution and filter it in meaningful ways through actionable dashboards, alerts, and New Relic One programmable applications.
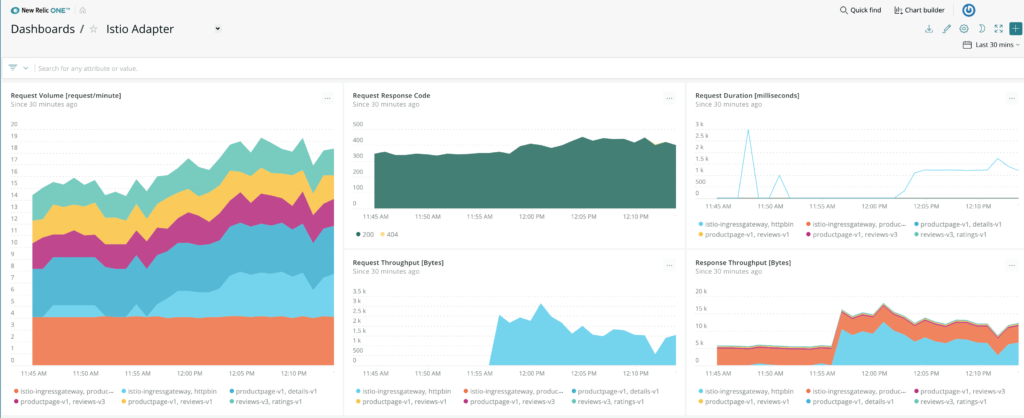
For example, the newrelic-istio-adapter has a default configuration that sends metrics representing the "four golden signals" for all services within the service mesh: error rates, latency, request volume, and throughput.

Any service running in the service mesh is monitored for these critical, customer-centric signals. You won’t need to reconfigure any service or install a New Relic agent.
Istio trace data
The good news doesn’t stop there: Any service within the service mesh that supports Zipkin (b3-propagation) traces can have spans sent to New Relic using the newrelic-istio-adapter. Even services you haven’t instrumented with New Relic agents (i.e., open source components of a system) can be included in New Relic’s distributed tracing simply by operating within the service mesh.

Getting started with the newrelic-istio-adapter
The newrelic-istio-adapter GitHub repository has all the information you need to start gathering metrics and traces from Istio. For more information on how Istio Mixer telemetry is created and collected, refer to this overview on the Mixer configuration model.
Key requirements include:
- A Kubernetes cluster
- A working kubectl installation
- A working Helm installation
- An Istio deployment, including an installed and configured Istio Mixer server
- A New Relic Insert API Key
- An APM Pro account
Note: Metrics and traces exported from this adapter to New Relic are rate limited. See the New Relic documentation for Trace API general requirements and limits and Metric API limits and restricted attributes for more information.
Instructions for deploying the adapter with Helm, as well as for enabling distributed tracing to send trace spans from services within the Istio service mesh to New Relic, are available in the GitHub repo.
We’ve also provided a dashboard template that charts Istio Metrics from our default configuration. The template is designed to be imported with the Insights Dashboard API. The dashboards are available in New Relic Insights and as New Relic One dashboards.
Contributing to the newrelic-istio-adapter
We welcome contributions to the newrelic-istio-adapter or any of our open source applications. If you’d like to contribute, please review our Contributors Guide. Keep in mind that when you submit your pull request, you'll need to sign our contributor licensing agreement (CLA). If you'd like to execute our corporate CLA, or if you have any questions, please drop us an email at opensource@newrelic.com.
The views expressed on this blog are those of the author and do not necessarily reflect the views of New Relic. Any solutions offered by the author are environment-specific and not part of the commercial solutions or support offered by New Relic. Please join us exclusively at the Explorers Hub (discuss.newrelic.com) for questions and support related to this blog post. This blog may contain links to content on third-party sites. By providing such links, New Relic does not adopt, guarantee, approve or endorse the information, views or products available on such sites.


