 New Relic has been working with Pivotal to develop comprehensive solutions to instrument, monitor, measure, optimize, and accelerate Pivotal Cloud Foundry (PCF) deployments at every stage of an enterprise’s digital transformation. We are excited to share these solutions at Pivotal’s annual conference—SpringOne Platform—in Washington, D.C., September 24-27, 2018.
We’ll deliver hands-on workshops, host a private networking event for our customers and partners, and conduct lightning talks and solution demonstrations at the New Relic booth on the show floor. Developers, operations engineers, and executive leaders won’t want to miss our platform’s exciting new capabilities.
Digital transformation with Pivotal Cloud Foundry
Pivotal’s focus on application modernization is driven by recent trends in API-first architectures, containers, continuous integration/continuous deployment (CI/CD), and DevOps.
Pivotal’s value is focused on four key areas:

The PCF platform enables agile processes that play a crucial role in modernizing how teams develop and maintain their applications. Given the potential impact of the overall transformation Pivotal can deliver, tools like New Relic are essential to enable development with modern software architectures, to monitor and resolve issues, and to showcase an application's overall business value.
Pivotal + New Relic: the value ecosystem
Visibility, Value, and Velocity. These are the critical benefits New Relic brings to a digital transformation using PCF. This is true whether you’re in the planning (or proof of concept) phase, the deploy phase (initial application deployments or running build-and-deploy automation), or the run phase (operations, continuous improvements, and customer experience).
Visibility across the entire stack
With prescriptive metrics and ready-to-go dashboards, New Relic provides end-to-end stack monitoring of PCF environments, including infrastructure, applications, microservices, and containers:
- New Relic Service Broker can deploy New Relic APM 360 agents to monitor your applications on PCF.
- New Relic Nozzle monitors PCF infrastructure components.
- New Relic Browser and New Relic Mobile capture data on end-user experience.
- New Relic Synthetics simulates user engagements so you can proactively identify user issues.
- New Relic Spring instrumentation gives you New Relic APM’s complete visibility into Spring applications and services.


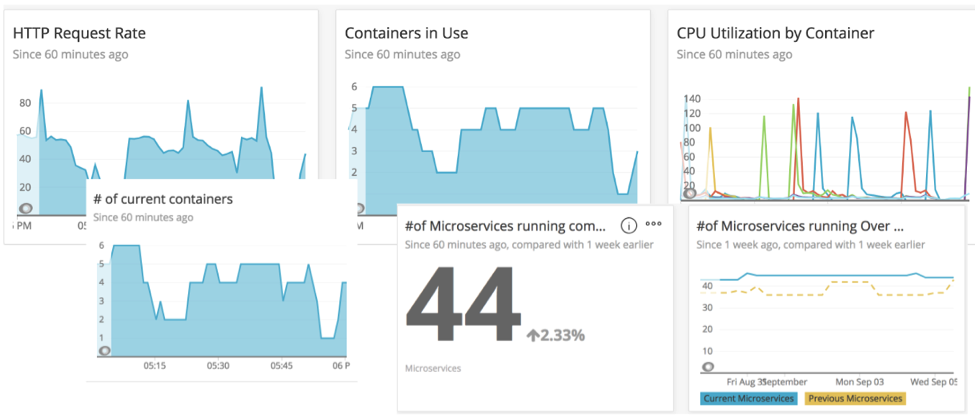
In addition, at FutureStack18 San Francisco, New Relic announced two new alerting capabilities: outlier detection and incident context.
Outlier detection can automatically detect misconfigured or misbehaving application instances. It also helps engineers determine when infrastructure operations and orchestration breaks down, and when clusters, application instances, or pools of resources are not properly balanced due to one or more “bad actors.”
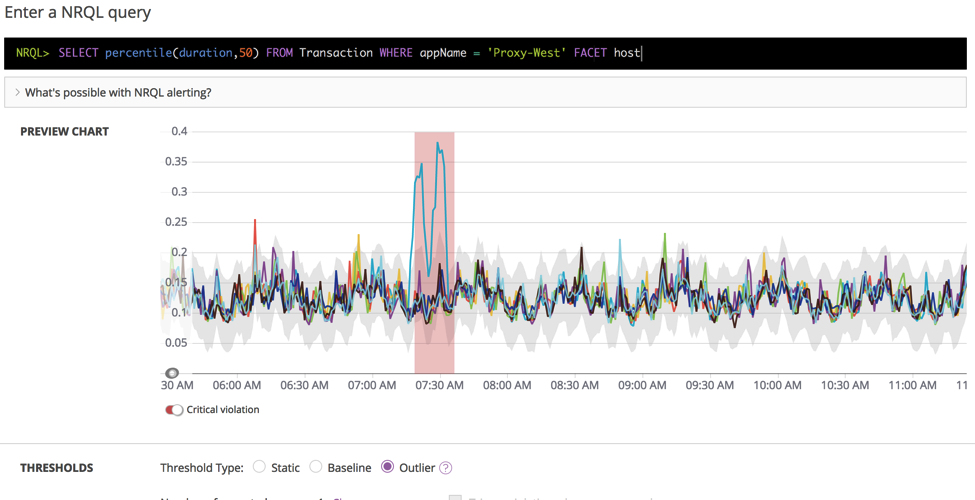
Incident context in New Relic Alerts surfaces performance anomalies and offers intelligent suggestions for where to start incident investigations, speeding up troubleshooting and resolution.
The power of this ecosystem lies in its ability to capture data from deployed applications, PCF infrastructure components, and end-user experience, and then correlate that performance and behavior data in New Relic Insights.
Value: business metrics delivered at every phase
Pivotal uses the value-stream analysis methodology to articulate the business metrics and KPIs delivered by PCF deployments. These metrics and KPIs are quantified across five value areas ("5S"): speed, stability, scalability, savings, and security.
New Relic has developed a curated set of analytics using New Relic Insights that integrates the New Relic value methodology with Pivotal’s value-stream analysis methodology. Customers can now track the progress of their transformation projects using New Relic’s prescriptive business dashboards that leverage data collected from PCF deployments and translate them into key business metrics for Pivotal’s five value areas. New Relic Insights lets you correlate the business KPIs with the application and PCF infrastructure data so you can drill down to specific issues identified in the business dashboards:
Speed
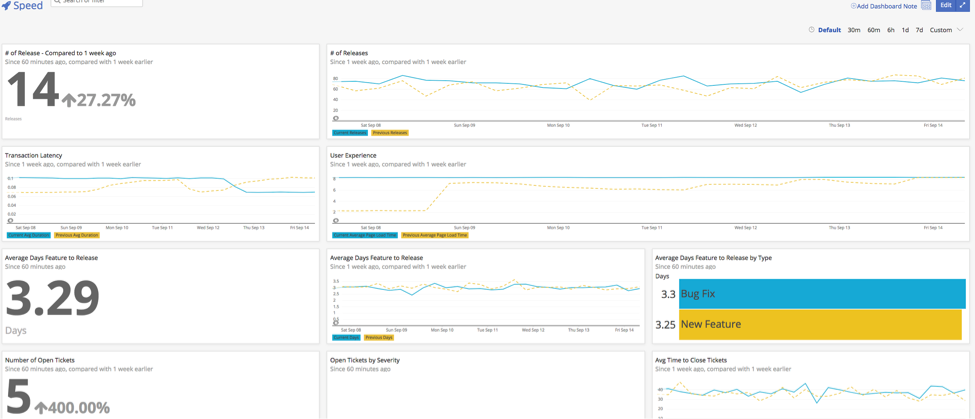
The Speed dashboard measures business KPIs for velocity and quality of releases, developer productivity, and impact on user experience. Service Level Indicators (SLIs) monitored include number of deploys to production, number of bugs, bug-fix duration, new release duration, number of code check-ins, number of tickets, time to deployment, and more.
Stability
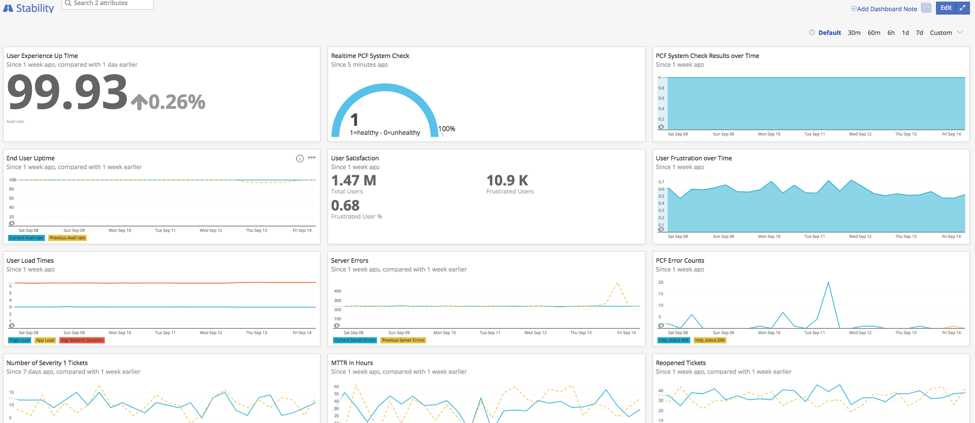
The Stability dashboard measures business KPIs for system uptime, MTTR, and user satisfaction. SLIs monitored include PCF system failures, user lead times, error rates, number of severity 1 incidents, average time to push updates, and more.
Scalability
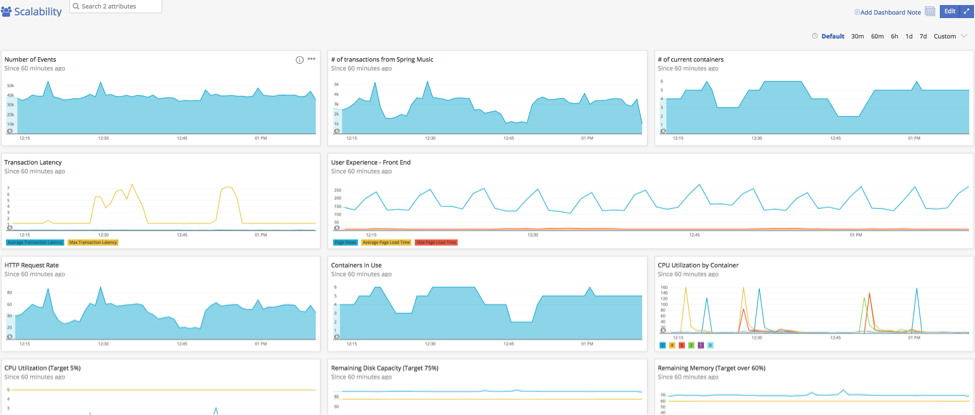
The Scalability dashboard measures business KPIs for system exhaustion and user experience. SLIs monitored include transaction throughput, transaction latency, container scaling, CPU usage, memory usage, disk capacity, and more.
Savings
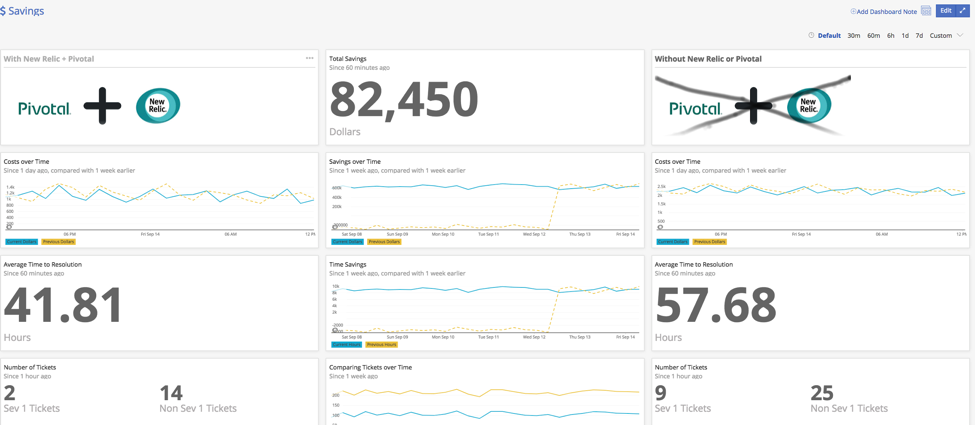
The Savings dashboard measures business KPIs for cutting costs through quicker and better quality releases, bug fixes, developer productivity, operational efficiency, and increased uptime. SLIs monitored include number of tickets, dollar savings, time to resolution gain, increase in deployments, numbers of bugs, and more.
Executive objectives
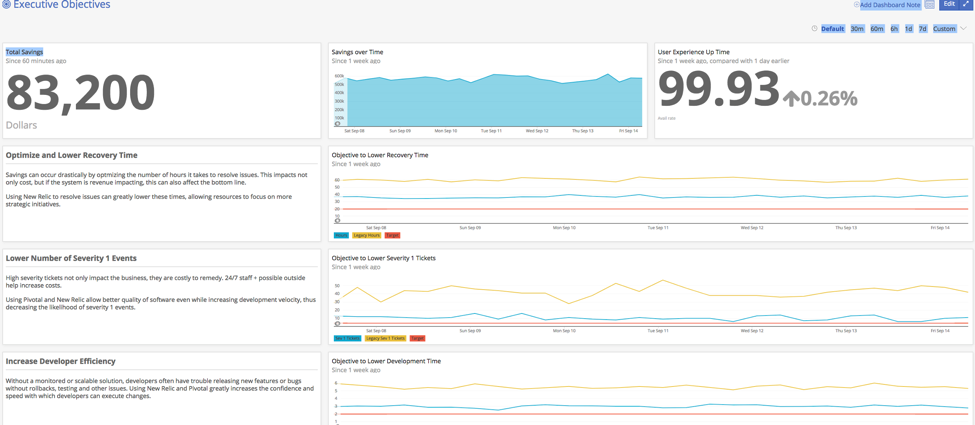
The Executive Summary dashboard showcases metrics addressing the overall objectives for the business: savings, developer efficiency, user experience, operational efficiency, recovery time, and more.
In addition to the "5S" solution dashboards, customers can use New Relic to build custom dashboards and add metrics specific to their own business objectives.Putting it all together, New Relic incorporates the data collected across your PCF environment, integrates it with external systems (such as bug tracking, financial, or agile process tools), and tracks that data against the business metrics most relevant to you.
Velocity: Accelerate new business services to market
To see how New Relic and Pivotal work together to help drive business velocity, consider the story of West Corp. A leader in global communications and infrastructure services, West has adopted Pivotal and New Relic to drive its digital transformation. West migrated hundreds of its legacy applications to PCF, enabling modern and agile architectures to help it make the leap to a cloud-based, microservices application delivery model.
West used New Relic to provide the visibility it needed to accelerate workload migration to PCF, and to help ensure reliability, availability, and performance of those workloads. West reduced risk to new deployments by identifying issues in its code before moving that code to production. In all, West used New Relic and PCF to connect overall performance to business outcomes, adopted agile devops practices, and ultimately accelerated its application delivery process.
For the full story, read West Corp. Relies on New Relic and Pivotal to Support Its Agile Transformation, or join us for a lightning talk by West CTO Thomas Squeo at the New Relic booth (#17 on the show floor) at SpringOne Platform, on Wednesday, September 26th, 2018, at 1:30 p.m. ET.
To see all of the New Relic/Pivotal solutions and integrations in action at SpringOne Platform:
- Visit the New Relic booth #17 on the exhibition floor
- Attend a customer talk by West Corp at the New Relic booth on Wednesday, September 26th, at 1:30 p.m. ET.
- Join us at our pre-event workshop on Monday, September 24th
- Network with our experts, customers, and partners at our exclusive happy hour on Tuesday, September 25 from 5:30 p.m. - 8:30 p.m. ET.
We look forward to seeing you at SpringOne Platform 2018.
Note: Event dates, speakers, and schedules are subject to change without notice.
The views expressed on this blog are those of the author and do not necessarily reflect the views of New Relic. Any solutions offered by the author are environment-specific and not part of the commercial solutions or support offered by New Relic. Please join us exclusively at the Explorers Hub (discuss.newrelic.com) for questions and support related to this blog post. This blog may contain links to content on third-party sites. By providing such links, New Relic does not adopt, guarantee, approve or endorse the information, views or products available on such sites.


