
Uptime Is Everything
Why Observability Is Critical For Uptime
Building, delivering, and operating software is now a strategic priority for businesses in just about every industry.
Software now defines and delivers the customer and prospect experience at almost every level and making sure these experiences are available, online, and performing well is essential.
Our "Uptime Is Everything" eBook outlines:
- The hard costs of downtime
- The barriers to reliability and fast, smart recovery
- Three imperatives for context
Understand why observability is so important to today’s businesses and gain context so you can deal with downtime.
Introduction
Every business is now a technology company.
Think about it—building, delivering, and operating software is now a strategic priority for businesses in just about every industry.
For some, it’s about staying competitive in the face of ever-increasing customer expectations. For others, it’s about being the disruptor in rapidly changing marketplaces flooded with new entrants.
But no matter what industry you’re in, software now defines and delivers the customer and prospect experience at almost every level, from first impressions to detailed interactions.
And making sure these experiences are available, online, and performing well is essential.
But software doesn’t just stay up and running.
Especially when you’re constantly updating and enhancing it. There is invariably downtime.
The challenge for technology and DevOps teams is that there’s a complex web of systems and infrastructure keeping all that software up and running. And there’s an even more complex, distributed web of agents monitoring all the different parts of the stack.
So when something goes wrong and the software is slow and unresponsive—or worse, completely down—every minute spent accurately diagnosing and troubleshooting these issues is one minute too long.
And you don’t just need to know what went wrong; you need to know why it went wrong and how to respond. To be able to do that, you need the full record of everything that happened and how different systems interact with each other.
That takes context
That is, it takes a single view of all your telemetry data to see how your customers’ experiences map back to applications, how those applications map back to infrastructure, and how that infrastructure maps to the other systems around it.
When you can connect all of those dots, you can start to see what could go wrong, what did go wrong, why it went wrong, and what to do about it.
In this guide, we’ll look at why this kind of contextual observability is so important to today’s businesses—and what prevents you from having it.
The hard costs of downtime (and the even harder ones most organizations miss)
The superficial hard cost of downtime is relatively easy to calculate.
It’s the average cost per minute of downtime multiplied by the number of minutes you spend in downtime.
For instance, when Costco’s website went down on Thanksgiving in 2019 for several hours, some experts estimated it cost them $11 million in lost sales.
Now, of course, the cost of downtime averages vary across industries and will be unique for your business. But there are some averages you can use as a guide.
According to Gartner, the average cost of downtime is $5,600 per minute. However, the cost can vary from $140,000 per hour to $540,000 per hour, so there will be variances.
In fact, 98% of organizations report downtime costs over $100,000 per hour, 81% put the cost at over $300,000 per hour, and 33% of those said that one hour of downtime costs $1 million to $5 million.
The quantifiable costs
In the best-case scenario, engineers detect an issue before it affects any customers. In the worst-case scenario, an issue goes undetected for seconds, minutes, or even hours until a customer is negatively impacted and alerts the company to the problem.
Imagine an e-commerce company has an incident that causes the payment gateway to go down for five minutes.
If five engineers work for two hours investigating, troubleshooting, and reporting on the incident, then the cost of getting from downtime to uptime is an engineer’s hourly wage multiplied by 10.
But what about lost sales?
Imagine an e-commerce company making 24,000 sales a minute where the average revenue from sales is $280,000 per minute. Lost revenue from sales during downtime is $280,000 per minute, but there are also the 24,000 dissatisfied customers to consider.
You also need to factor in the cost of acquiring customers in the first place, the negative effects of bad PR or word of mouth from unhappy customers, and the cost of re-acquiring customers who have many options.
The harder costs
Then there is the human cost of outages and downtime. From 3 a.m. alerts to interrupted vacations and even job loss, there’s a massive strain on your team caused by investigating and resolving downtime issues. Whether it’s the distraction of being continually pinged or the frustration associated with troubleshooting, this strain will eventually lead to staff attrition.
And the opportunity cost is even higher. There’s the loss of productivity caused by DevOps and IT personnel being pulled off more strategic projects to investigate, troubleshoot, and report on outages and performance issues. This is, perhaps, the greatest business cost and the most difficult to calculate.
Calculating the cost of lost productivity will depend on your growth strategy, the role of software deployment in this strategy, and the value of infrastructure in your company.
Regardless of the numbers, the price is high, and the indirect effect of lost productivity runs deep. The business loses out to competitors, misses market opportunities, and starts to stagnate.
The barriers to reliability and fast, smart recovery
Downtime comes at a cost, but a lack of context comes at an even higher cost—recurring downtime. This causes extended, exhaustive troubleshooting and growing customer dissatisfaction. Without the context of why your system went down, you’re not recovering cleverly, and you’re not building in resilience no matter how fast you get to uptime.
So why is it so hard to get that context?
1. The increasing complexity of applications, infrastructure, and services
The tools for monitoring and troubleshooting traditional monolithic application patterns and static, fixed infrastructure weren’t built for the complexity of today’s infrastructure.
Modern container-based infrastructure deployed in hybrid and multi-cloud environments is, by definition, sprawling and ephemeral, requiring entirely new operating approaches.
Automation, continuous integration/continuous delivery (CI/CD) pipelines, and Kubernetes-based compute surfaces change topologies and migrate resources constantly.
Modular applications are composed of various open source and proprietary technologies, written in multiple languages and frameworks that change fast.
That’s a lot of complexity to navigate.
2. There’s a gap between your applications and infrastructure
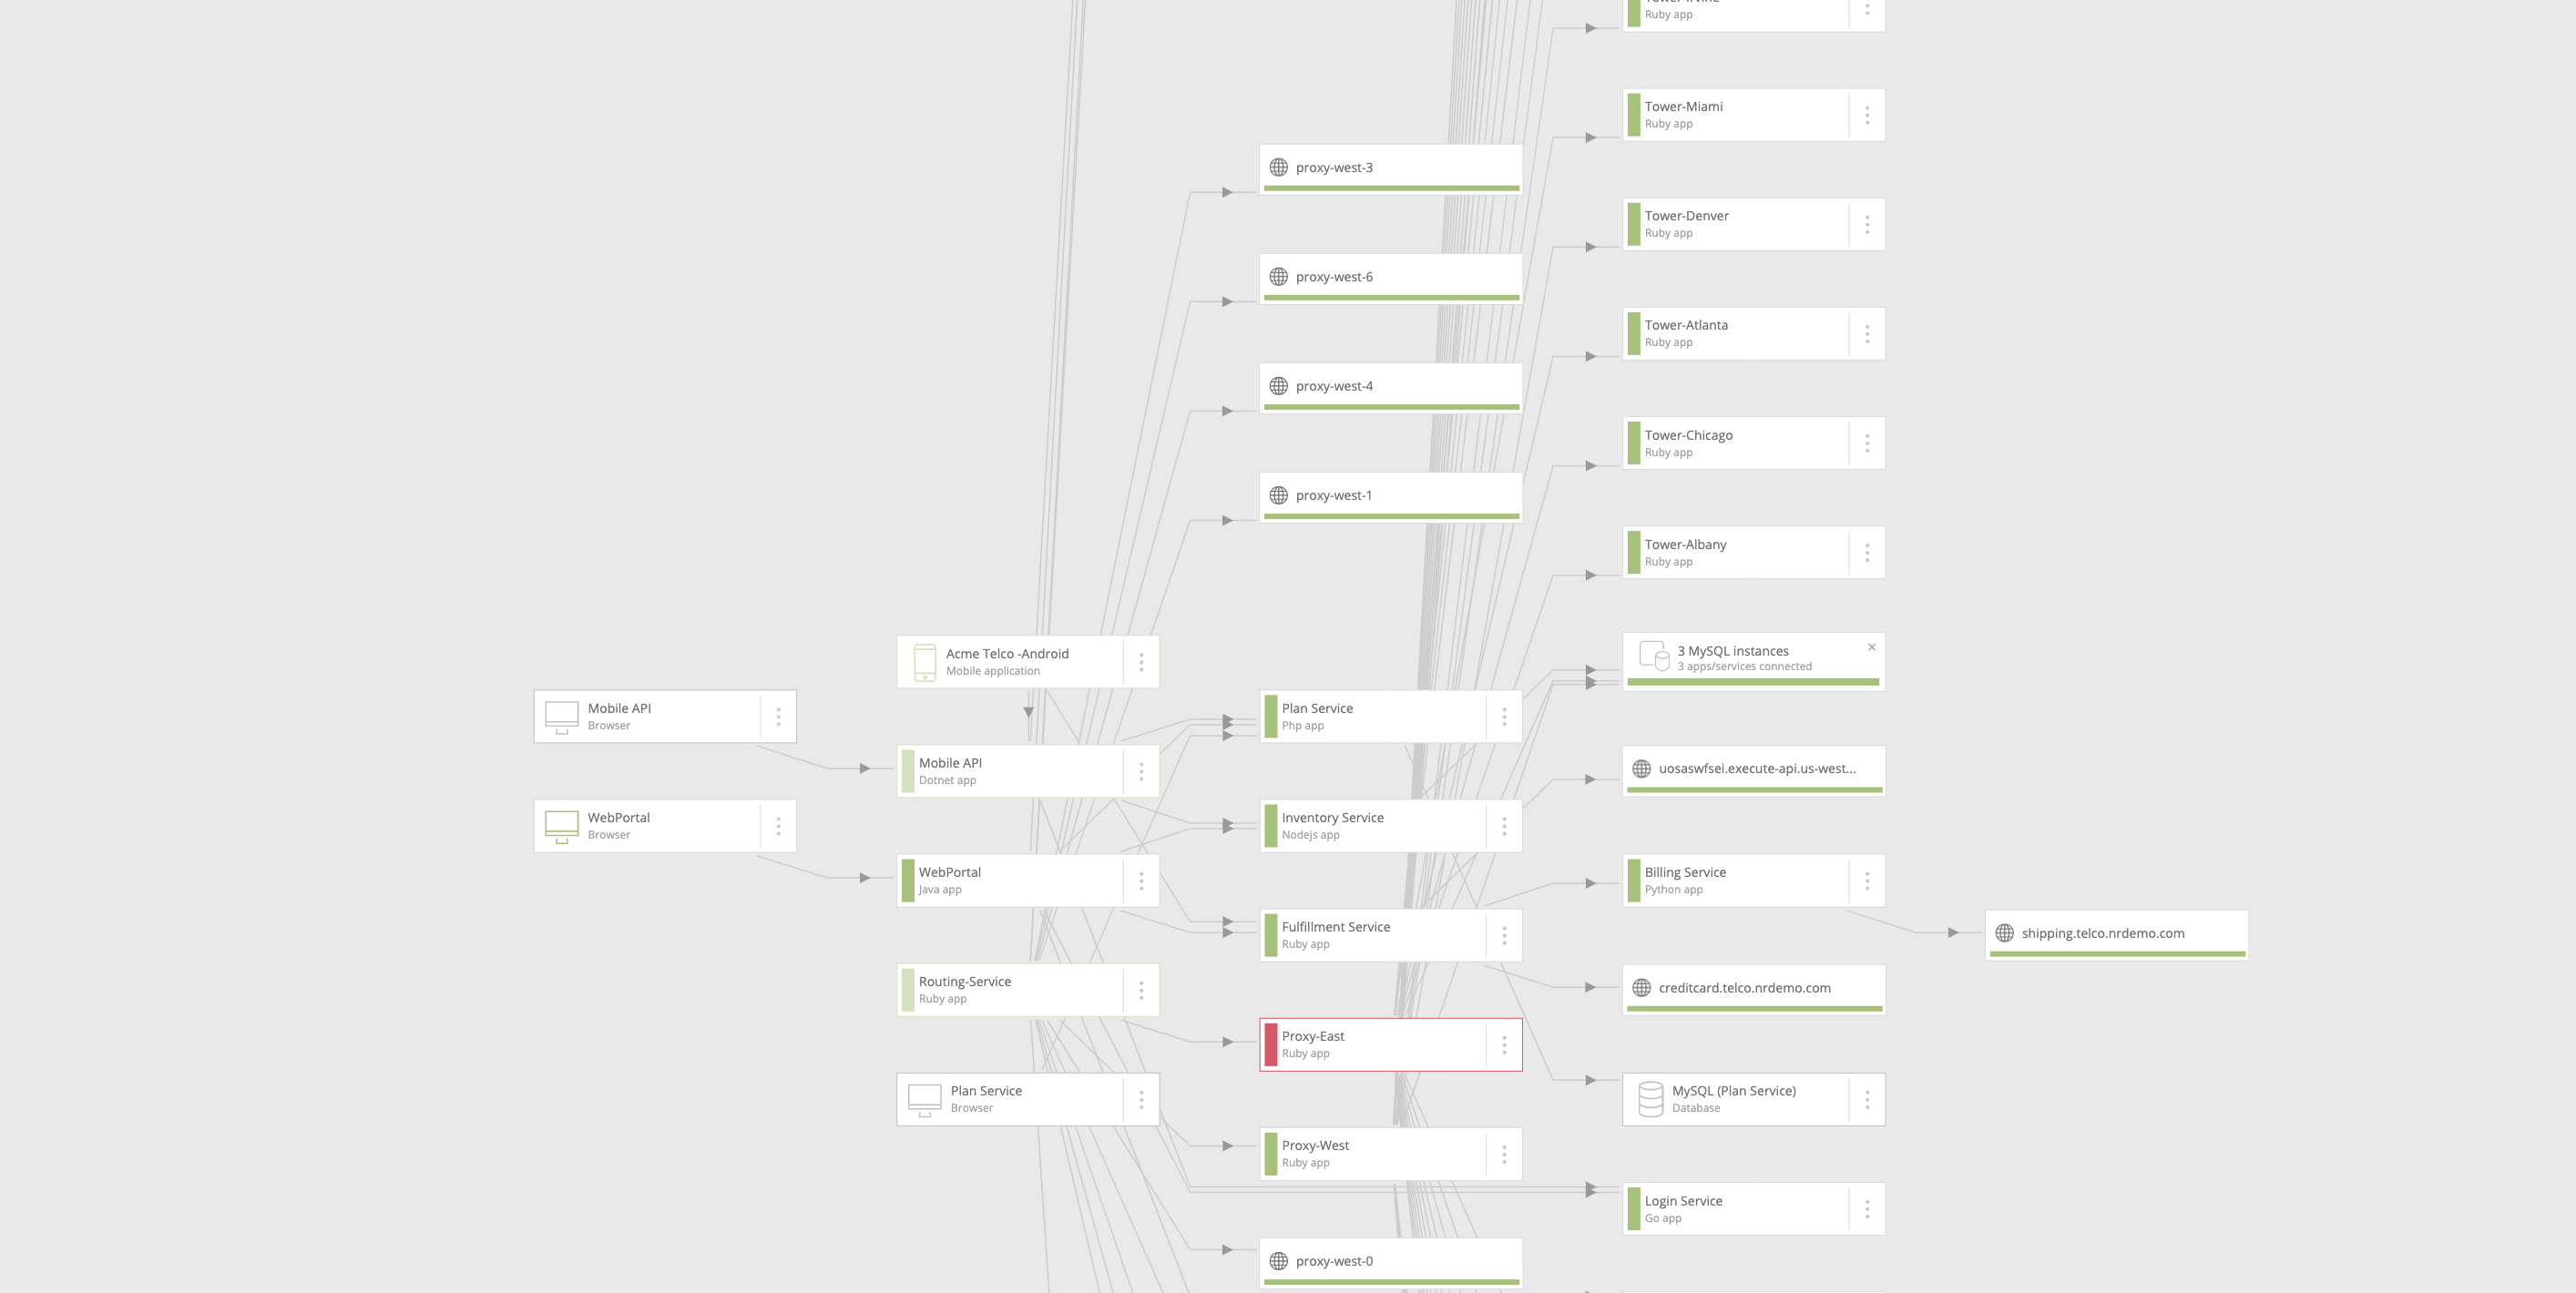
Without an integrated, correlated view between your applications (including third-party services accessed through APIs) and infrastructure, you don’t get the end-to-end view you need to make informed decisions.
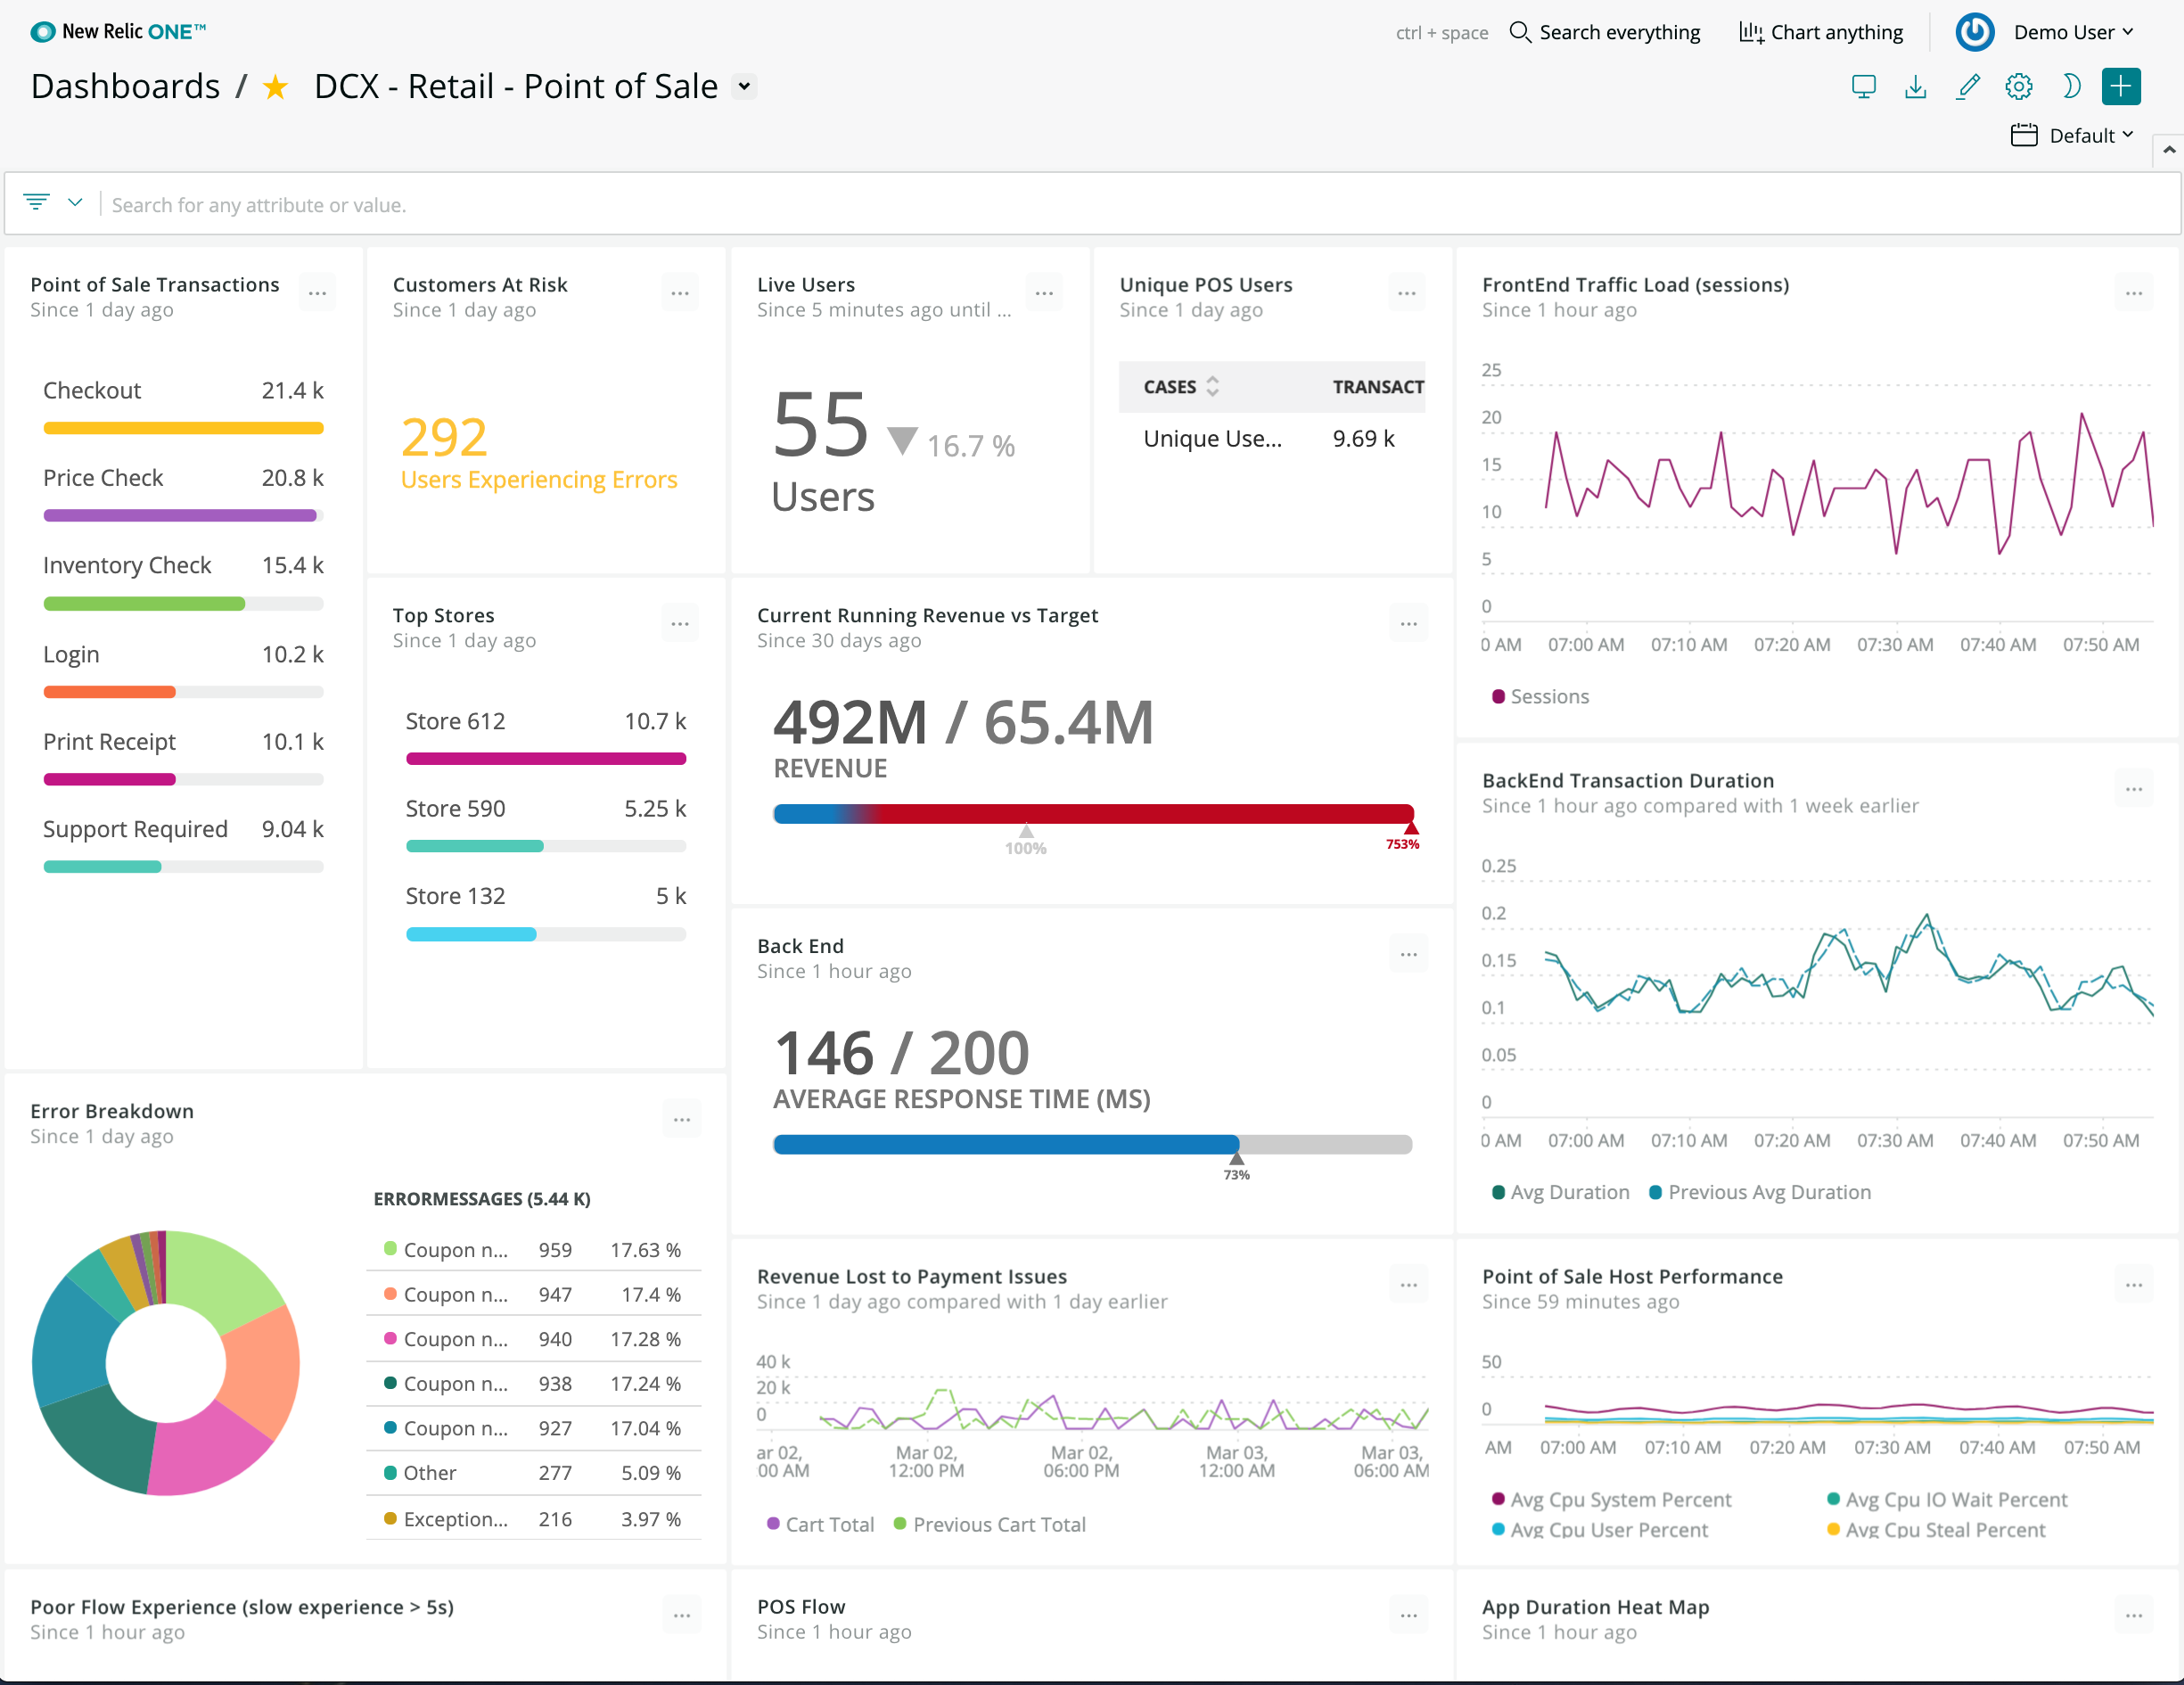
And since your applications and infrastructure are unique to your business, relying on static, stock dashboards isn’t enough.
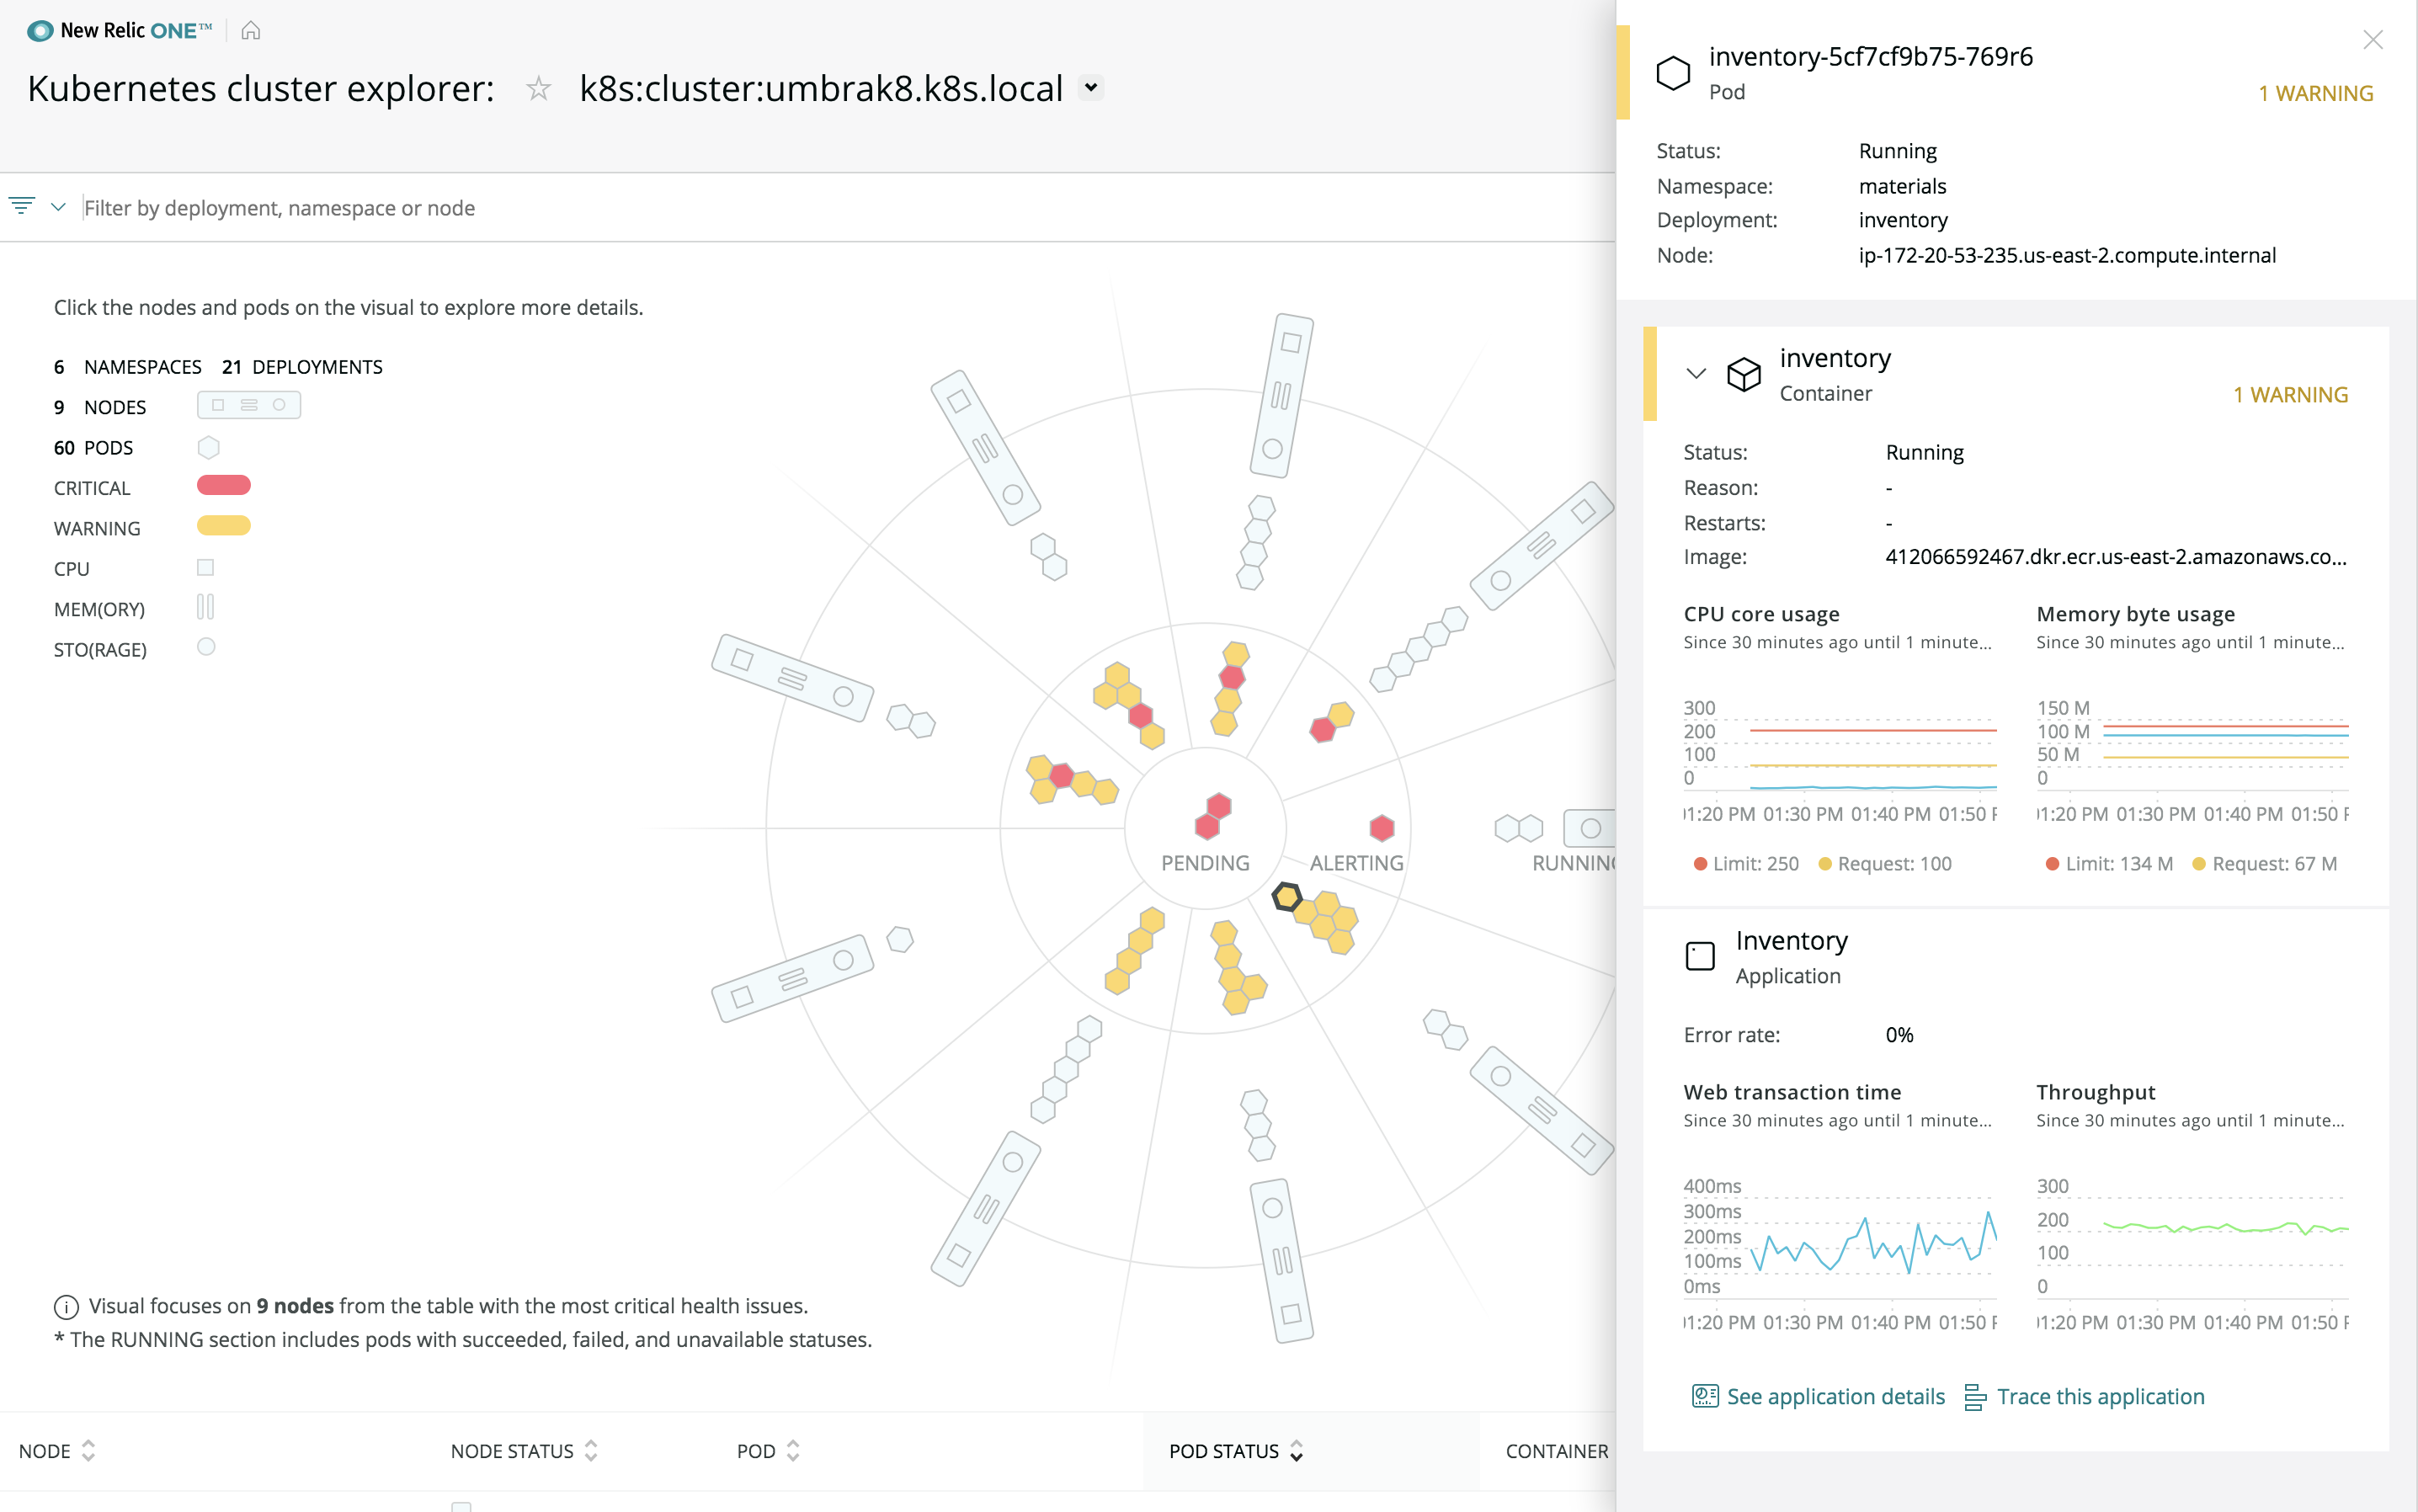
Sure, a dashboard can show you how much compute a specific server is provisioning. But if you’re trying to analyze system health in the context of a multi-cloud workflow, you’re going to need to develop your own observability application to do it.
3. Tool sprawl
When you use multiple tools to monitor multiple parts of your stack, you invariably get blind spots. Worse still, you make it infinitely harder to aggregate a holistic view of how all these systems work with each other.
It’s just hard to investigate incidents. And, as it turns out, free, open source monitoring tools come at a price. Organizations pay the price in hours and resources to manage those tools that also lack reliability.
Every second a DevOps person wastes having to context-switch from one tool to another is another second of downtime you don’t need to deal with.
Three imperatives for context
To get the kind of contextual observability that helps you prevent issues from occurring and be able to respond to them more intelligently, you need to make sure you’re using an observability platform that has three critical characteristics:
- Open: So you can monitor every system and source of performance data you use today as well as the ones you’ll use tomorrow.
- Connected: So you can track performance all the way from what your customer experiences in the browser or mobile device to the underlying infrastructure, whether that’s in the cloud, on-premises, or in a hybrid environment.
- Programmable: So you can build customized applications, visualizations, and workflows that represent the specific context and data that matter to your business.
The combination of these three capabilities will help you maintain availability and uptime while allowing your team to prevent future incidents proactively.
This is how you go beyond monitoring and into true observability.
Conclusion
In a software-powered world, observability is the goal.
Software is the key interaction point between your business and your customers. So the uptime, availability, and performance of that software aren’t just about costs.
It’s about making sure your business lives up to its promises.
The key to maintaining uptime, availability, and performance lies in the ability to collect, correlate, and contextualize data about your software.
You need the context so you can deal with downtime the same way the world’s best software companies do: on the front foot.
You’ll waste less time and less money. Your DevOps and infrastructure teams will take off nights and weekends.
Most important, your customers will know they can rely on your business to do what it says it will.
We’re New Relic, and we wrote this for you.
New Relic One is an open, connected, and programmable platform that gives you end-to-end, contextual observability across your entire tech stack. It gives you a consolidated view of all your data, from your customers’ browser and mobile device experiences to your applications and infrastructure, wherever it runs. This reduces blindspots, provides context, and gives you insights across artificial organizational boundaries—so you can quickly find and fix problems.
Find out how we can help you maintain availability and uptime.


