The promise of any synthetic monitoring tool is the ability to proactively alert you about an outage and give you context into why that problem occurred so you can fix it before users are impacted.
Of course, we would never allow our customers to use just any synthetic monitoring tool. Our customers deserve the best possible technology to fully watch and detect their critical customer-facing endpoints, which is one of the reasons we’re excited to announce we’ve migrated our Synthetics to the New Relic One platform.
By adding Synthetics into New Relic One, you now have immediate and full context into your application’s availability, depth across transactions, errors, performance, and functionality, as well as the connection of endpoint outages to your underlying applications. With Synthetics in New Relic One, you will now be able to more quickly find, communicate, and fix outages and latencies, and improve your overall customer experience.
And since your synthetic data is closely linked to your customer data, backend services data, infrastructure data, and other tools for troubleshooting (distributed tracing and logs, for instance)—and because Synthetics is one of a platform of New Relic tools—you now have the full context for “what caused,” and “what teams are responsible” for outages, errors, and latency.
In the process of migrating Synthetics to New Relic One, we’ve also added several new features and enhancements, including improved entity search, location health, chart filtering capabilities, and more.
What’s New in Synthetics?
The move to the New Relic One platform brings many benefits to our Synthetics customers, from being able to search monitors (and properties) across accounts to viewing monitor status in-context. Here are some of the biggest improvements and features we’ve added.
Entity Search
In New Relic One, Synthetics provides all of the configurable values of a monitor as properties, so customers can search for monitors via location, period (formerly frequency), type, and more right from the entity search:
Current Health Banner
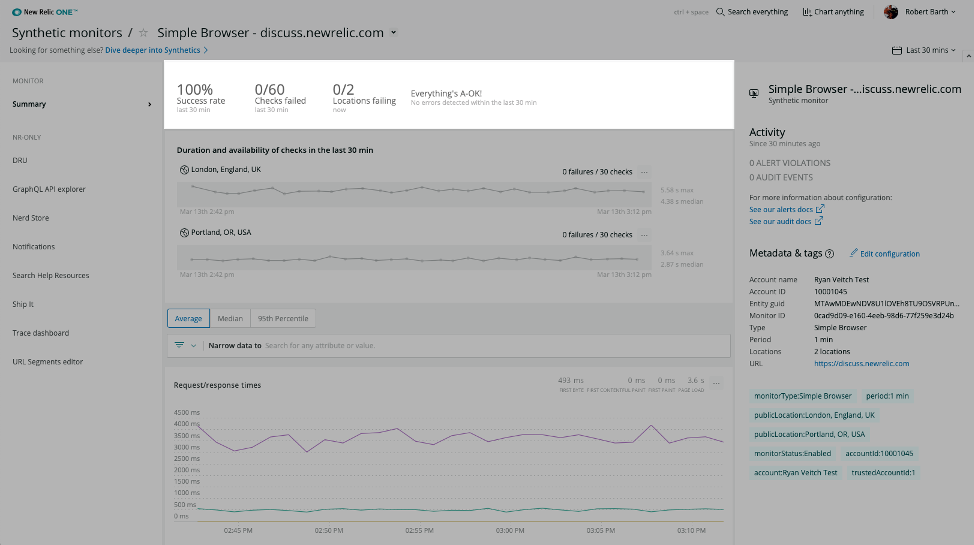
The new experience for viewing a monitor starts with the current health of the monitor right at the top:
The banner includes information that will tell you right away the health of your monitor, including:
- Success rate
- Number of failed checks
- Number of failing locations
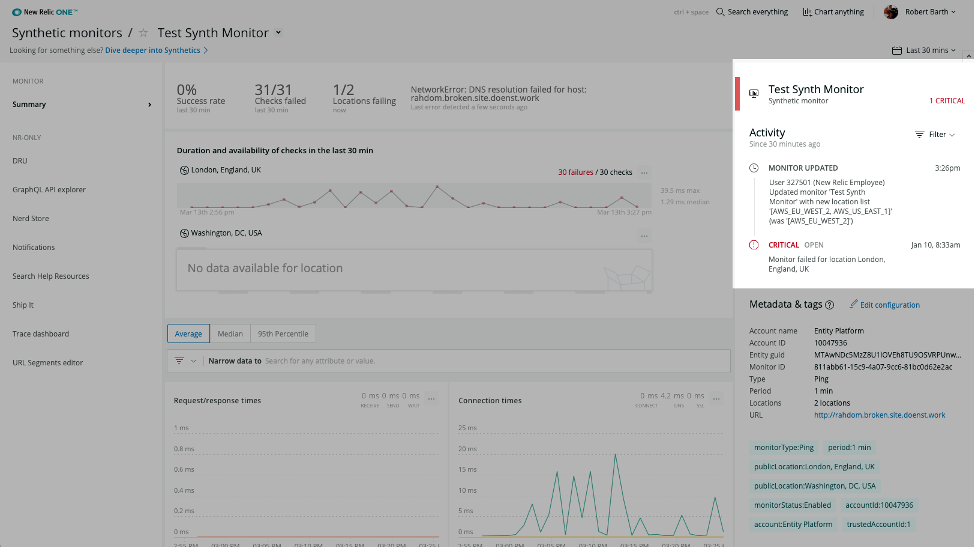
- Any alerts that have occurred over the past few minutes
This gives you a great view of the recent health of the monitor.
Location Health
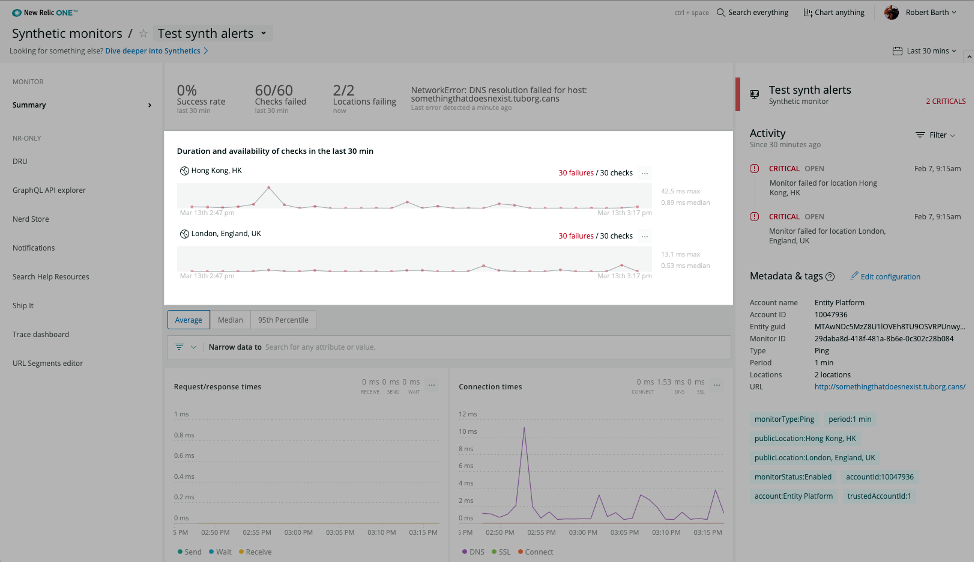
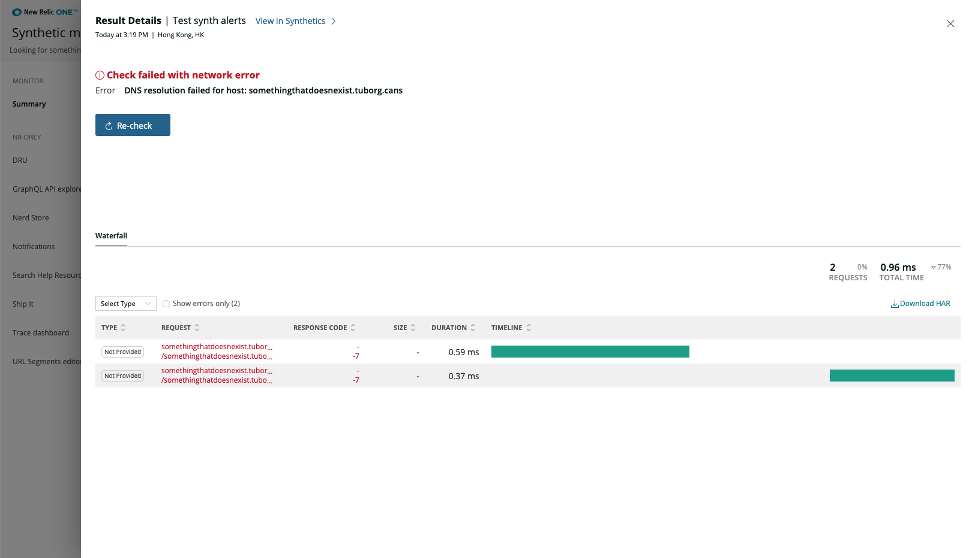
Right below the current health banner, the new location health charts show you exactly which locations are currently failing. Each location’s recent check status is shown, with failures sorted to the top so you can quickly identify which locations need attention. Additionally, you can click on any of the data points in any of the location charts to see the detailed result data for that check:
New Default Charts and Chart Filtering Capabilities
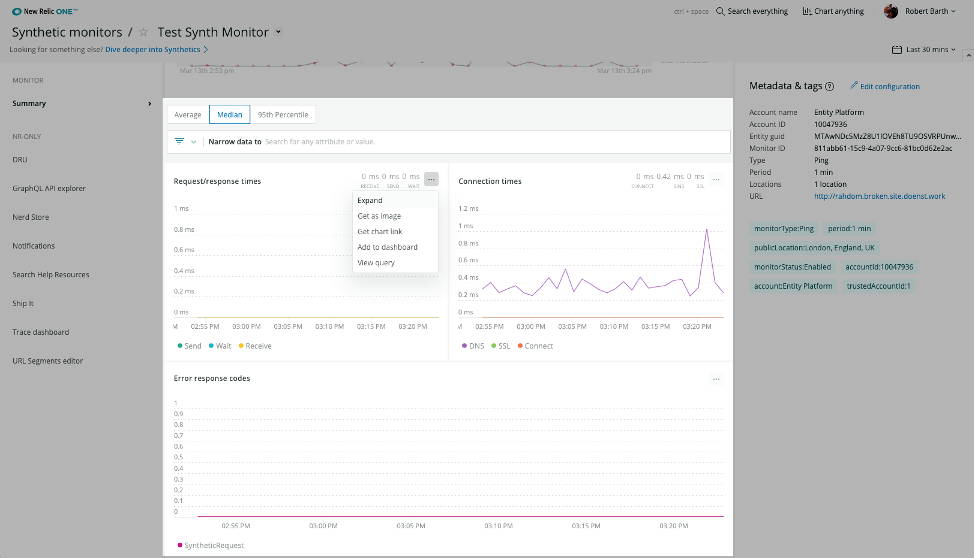
We have also curated a set of charts on the monitor page, specific to the type of monitor that is being viewed. The charts will help you more quickly understand why your monitor is failing, and with the timepicker, allow you to explore the monitor’s performance over time. Additionally, you can view the average, median, or 95th percentile data in each of the charts with the click of a button.
The charts may now also be filtered by monitor property—such as location or host—allowing you to determine if failures are correlated with specific attributes.
Now, each chart can be expanded, and you can get a link to the chart, add it to a dashboard, and view the NRQL query that generated the chart, all thanks to the New Relic One platform:
In-Context Data and Associated Application Status
One of the biggest changes to Synthetics in New Relic One is the ability to see in-context data and associated New Relic application status.
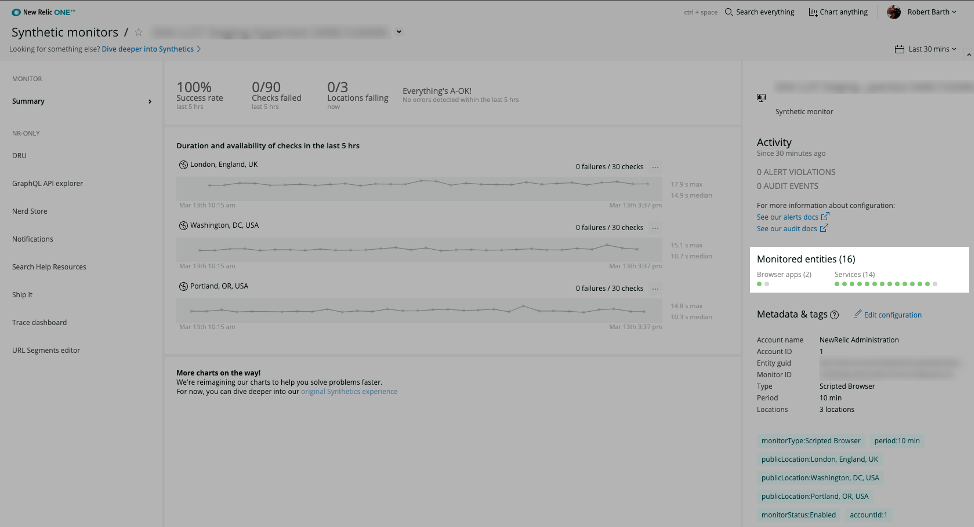
In the right pane, you will always see the activity for the monitor for the time window selected. This activity includes any open alerts, audit events (such as changes to the monitor), as well as APM and Browser application status associated with the monitor.
That means if you also have access to APM and/or Browser, New Relic will automatically figure out which APM and Browser applications the Synthetic monitor interacts with and show you the status of those applications right on this page so you can quickly determine if there is a larger issue associated with a failing monitor:
If you’re interested in trying Synthetics in New Relic One, start a free trial or request a demo.
本ブログに掲載されている見解は著者に所属するものであり、必ずしも New Relic 株式会社の公式見解であるわけではありません。また、本ブログには、外部サイトにアクセスするリンクが含まれる場合があります。それらリンク先の内容について、New Relic がいかなる保証も提供することはありません。


