Open source software is taking over cloud native instrumentation and creating new avenues for open, unified telemetry.
According to Gartner, “by 2025, 50% of new cloud-native application monitoring will use open-source instrumentation instead of vendor-specific agents for improved interoperability, up from 5% in 2019.”
Today, Gartner says that “open-source software is used within mission-critical IT workloads by over 95% of the IT organizations worldwide, whether they are aware of it or not.” Over the next two years, they continue “the percentage of open source within IT portfolios relative to either homegrown or licensed third-party solutions will grow by 30% compound annual growth rate (CAGR).”
At New Relic, we take these numbers seriously. Modern observability is powered by instrumentation that is largely vendor-agnostic and open. Unprecedented choice and innovation are helping you gather more telemetry than ever before. But when you lack a single, unified place to store that data and draw contextual relationships between it, you’re left with silos and operational burdens.
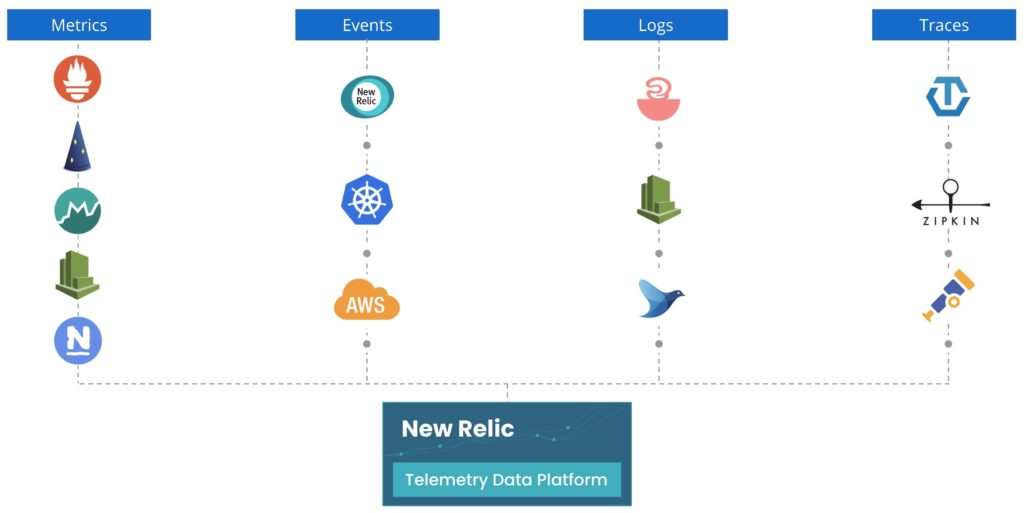
To help you simplify observability best practices across your complex organizations, we’ve launched a platform that can ingest metrics, events, logs, and traces from any source—whether from proprietary or open source agents, or via APIs and built-in instrumentation—and that can scale to handle the load on your biggest days with enterprise-grade capabilities.
Tool fragmentation creates observability silos
Take a look at the development teams around your organization. Chances are you’ll see teams running some combination of open source, legacy, and homegrown monitoring tools. Ever consider how much time it takes to maintain all these tools and data sources, and form meaningful links between them? Correlating issues across different tools and telemetry types is sometimes impossible due to the differences in the way data is stored and exposed from tool to tool.
How do you maintain acceptable mean time to detection and resolution when human interpretation is required every step of the way? How many minutes pass before you can get from an error in a log file to the corresponding traces that’ll actually help you resolve a real alert?
And let’s not even get started on the financial ramifications of these observability silos (though the folks in finance will eventually want you to deal with that, too).
Managing OSS data stores creates new burdens
But we get it—the promise of open source is compelling. Like most open source software, open source data stores are generally free (in terms of licensing), and they’re community- and user-supported, but they do come with many additional challenges. Your monitoring tools generate massive amounts of telemetry data, and that data needs to be available and accurate for your users.
Achieving the necessary availability and scale requires one of two paths: To host your data store on-premises, you need to purchase, configure, operate and manage additional complex and costly infrastructure—from hosts to storage to networking and more. If you choose to host your data store in a public cloud, you gain efficiencies by abstracting away the infrastructure, but you still have to worry about hiring and training experts to set up, configure, and operate your systems. Add in the complexity of scaling, retention, security, dedicated support, and these “free” solutions can present unique challenges. Often you end up monitoring your monitoring tools.
The Telemetry Data Platform changes all of this.
The Telemetry Data Platform: a single place for all your data
With the Telemetry Data Platform, you get one unified database to ingest, analyze, visualize, and alert on metrics, events, logs, and traces from any source, including—among plenty of others—Prometheus, Telegraf, OpenTelemetry, Logstash, and Kubernetes.

Free yourselves from tool sprawl and toil. You no longer need to operate separate data stores, monitoring and visualization tools, nor the infrastructure that supports your observability practices. Consolidate your workflows on the Telemetry Data Platform, and accelerate your MTTR.
Core benefits of the Telemetry Data Platform
Consider the following core benefits of the Telemetry Data Platform:
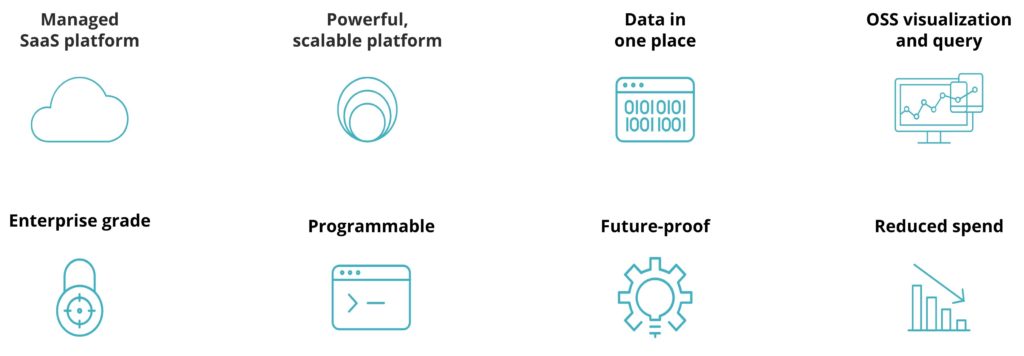
- It’s a fully managed Saas platform. The Telemetry Data Platform requires no additional infrastructure or operational resources—it’s a fully managed, multi-tenant platform. You automatically benefit from immediate access to the latest capabilities, features, and modern user experiences.
- It’s built to scale. Telemetry Data Platform is optimized for time-series metric, event, log, and trace data. You’ll drive real-time investigation with speed and flexibility at unlimited scale, even during your busiest peaks.
- It gives you all your data in one place. As an open, unified telemetry platform, the Telemetry Data Platform is a single place to ingest, analyze, visualize, and alert on metrics, events, logs, and traces from any telemetry source. You’ll be able to correlate all your data to create context for the relationships between that data, and more quickly resolve issues.
- It’s compatible with open source visualizations and queries. Do you already have dozens of Grafana dashboards and countless alerts that you don’t want to lose? Not a problem—add the Telemetry Data Platform as a new Prometheus data source in Grafana, and you can keep all your existing Grafana workflows.
- It comes with enterprise-grade security, access control, and compliance. The Telemetry Data Platform includes encryption-at-rest, role-based access control (RBAC), and 24x7 customer support. It’s also GDPR compliant and is certified for FedRAMP Authority to Operate.
- It’s a programmable platform. Build your own custom apps on top of your telemetry data, or use existing open source applications from the New Relic One Catalog to meet your unique data, software, and business needs.
- It’s comprehensive and future-proof. When you’re ready, expand into Full-Stack Observability and Applied Intelligence as your needs grow.
- It’s priced to work for you. To get started, our free tier gives you 100 GB per month, and is $0.40/GB beyond that. See our pricing page to learn about adding Full-Stack Observability and Applied Intelligence to the Telemetry Data Platform.
To learn more about the Telemetry Data Platform, check out our documentation.
Get ready for the future of observability
After you sign up for a free tier, you’ll need to start populating some data.
- For metrics data: Install the Prometheus and Grafana integrations
- For logs: Install the Logstash plugins
- For trace data: Configure an OpenTelemetry exporter
Sign up for 100GB of ingest per month and one Full-Stack Observability user license—free forever!
This post contains “forward-looking” statements, as that term is defined under the federal securities laws, including but not limited to statements regarding market trends and opportunities in cloud-native application monitoring using open source instrumentation and the expected increase in open source projects in IT portfolios. The achievement or success of the matters covered by such forward-looking statements are based on New Relic’s current assumptions, expectations, and beliefs and are subject to substantial risks, uncertainties, assumptions, and changes in circumstances that may cause New Relic’s actual results, performance, or achievements to differ materially from those expressed or implied in any forward-looking statement. Further information on factors that could affect New Relic’s financial and other results and the forward-looking statements in this post is included in the filings New Relic makes with the SEC from time to time, including in New Relic’s most recent Form 10-K, particularly under the captions “Risk Factors” and “Management’s Discussion and Analysis of Financial Condition and Results of Operations.” Copies of these documents may be obtained by visiting New Relic’s Investor Relations website at http://ir.newrelic.com or the SEC’s website at www.sec.gov. New Relic assumes no obligation and does not intend to update these forward-looking statements, except as required by law.
本ブログに掲載されている見解は著者に所属するものであり、必ずしも New Relic 株式会社の公式見解であるわけではありません。また、本ブログには、外部サイトにアクセスするリンクが含まれる場合があります。それらリンク先の内容について、New Relic がいかなる保証も提供することはありません。


