You’ve been asking for it, and now we’re excited to announce the general availability of one of our most requested integrations—StatsD. StatsD has emerged as one of the most popular tools for collecting and analyzing application metrics. It’s gained immense popularity over the past six years and many well-known enterprises that have adopted it as an essential tool for modern DevOps. We’re thrilled to provide this integration to New Relic Infrastructure Pro subscribers.
You can now monitor metrics sent to StatsD from New Relic Insights. The integration provides a flexible rule system for sending and categorizing large volumes of metric data so it can later be visualized using the New Relic Query Language (NRQL).
The integration is available now in the New Relic UI. Click Infrastructure > Integrations > On-host integrations and then select the StatsD integration link.
What is StatsD?
StatsD is a lightweight Node.js application built and open sourced by the engineering team at Etsy. It works by listening for metrics from different applications, aggregating them, and sending them onward to a configured backend. You can add backends to send the aggregated and summarized metrics to third-party systems, including New Relic Infrastructure.
StatsD + New Relic = metrics magic
StatsD listens for User Datagram Protocol (UDP) packages coming from the application on which you’ve installed it, and, after a configured period of time, flushes and aggregates the metrics you’ve specified.
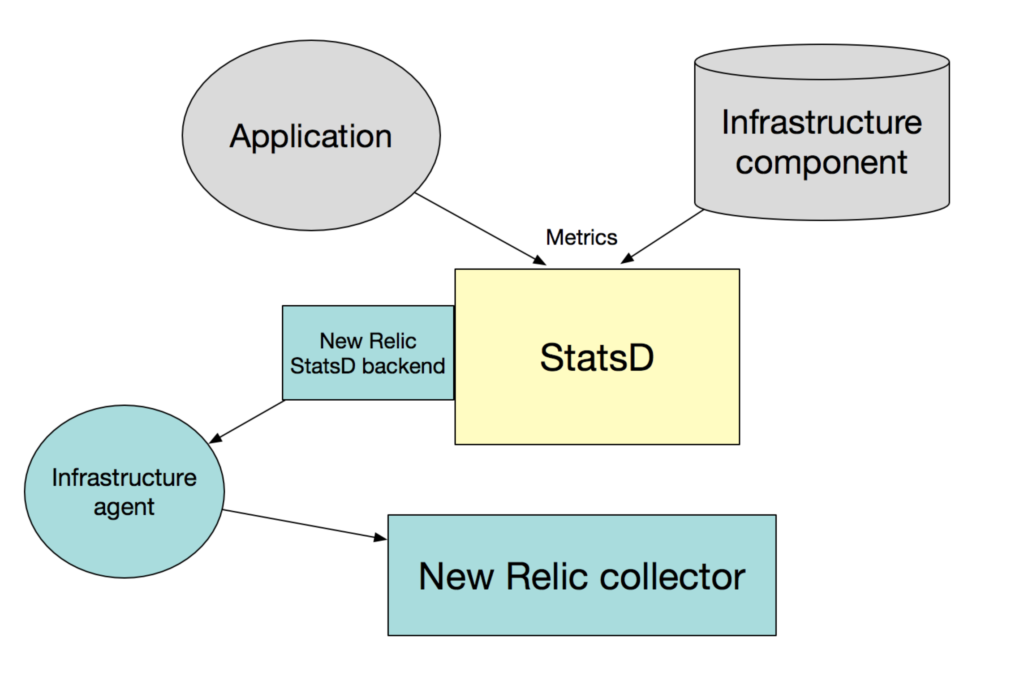
This diagram shows how data is sent from your application or infrastructure component to StatsD. The New Relic backend then takes the aggregated StatsD metric data and sends it to the Infrastructure agent using network sockets. Finally, the Infrastructure agent sends the data to New Relic.

StatsD metrics are expressed in this form: <metricname>:<value>|<type>. So in the example, app1.net.requests:234|c, we have:
- metricname:
app1.net.requests - value:
234 - type:
c(counter)
Metrics from StatsD are stored in New Relic Infrastructure in the form of samples. A sample is a list of key-value pairs that include metric data and metadata. For a full explanation of StatsD metric types and how aggregation works, check out the metrics types in their GitHub repo.
Using the StatsD integration
Let’s walk through an example that shows you how to push a metric from a Linux-based server to New Relic Infrastructure—to track, trend, manage, and alert on that particular metric.
To get started, you’ll need to have installed:
- The StatsD service (available on GitHub)
- The latest version of the New Relic Infrastructure agent installed on the host you’re monitoring
- A Linux distribution compatible with New Relic Infrastructure
(The New Relic documentation provides full instructions for activating and configuring the StatsD integration and includes example StatsD configuration files.)
First verify that the StatsD server is running and accepting metrics. From your terminal, run the command:
sudo systemctl status statsd
If everything is running, the server will return:
* statsd.service - Network daemon for aggregating statistics

Loaded: loaded (/lib/systemd/system/statsd.service: enabled: vendor present: enabled)

Active: active (running) since Wed 2018-01-08 10:53:40 MDT: 1 day 2h ago

…
Next, verify the New Relic Infrastructure agent is running with this command:
sudo systemctl status newrelic-infra.service
If everything is running, the agent will return:
* newrelic-infra.service - New Relic Infrastructure Agent

Loaded: loaded (/lib/systemd/system/newrelic-infra.service: enabled: vendor present: enabled)

Active: active (running) since Wed 2018-01-08 10:53:40 MDT: 1 day 2h ago

…
Finally, run the following test command to push an example metric (“42”) to the StatsD server from localhost to port 8125, the default port for listening for metrics coming in from StatsD.
echo "app1.production.localhost.sample_metric:42|g" | nc -w 1 -u 127.0.0.1 8125
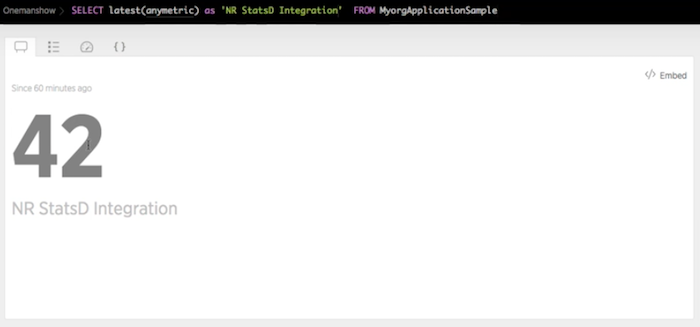
At this point, the integration sends that metric data to New Relic Infrastructure, where you can view it in New Relic Insights.

If this were a real metric you had pushed to StatsD, you could track, trend, manage, and alert on it as needed.
So many metrics to play with
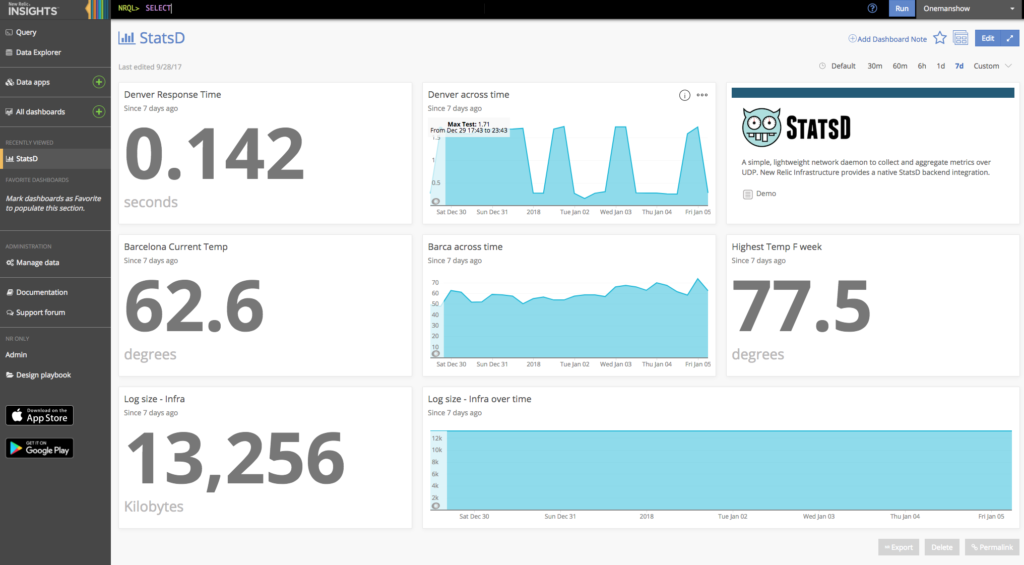
We know there are countless metrics you can collect with StatsD, so we’re excited to deliver this highly requested integration. Here’s a look at the some of the fun things we’ve been tracking with StatsD:

This dashboard tracking the temperature at New Relic’s European Development Center in Barcelona (where a lot of this integration work was accomplished), the response time of New Relic in Denver, Colo., and the log size (in kilobytes) of New Relic Infrastructure.
You can learn more about the Infrastructure StatsD Integration in the documentation. Also, check out our other integrations like Redis and Apache
Now it’s your turn. What metrics will you track, trend, and manage with StatsD and New Relic Infrastructure? For more on infrastructure project management and metric tracking, check out how we helped Zenhub.
本ブログに掲載されている見解は著者に所属するものであり、必ずしも New Relic 株式会社の公式見解であるわけではありません。また、本ブログには、外部サイトにアクセスするリンクが含まれる場合があります。それらリンク先の内容について、New Relic がいかなる保証も提供することはありません。


