Quickstart
What is ADO.net?
ADO.NET, also known as ActiveX Data Object, is the data access technology for the Microsoft .NET Framework. It has a set of object-oriented classes that can be used to connect to a database, provide access to relational data, application data, and XML, and retrieve results.
Common uses of ADO.net
You can utilize ADO.net to create reliable and scalable database apps for client- server applications, and work with several data sources. In addition, you can reduce the amount of code and level of maintenance needed for data-oriented applications by using the ADO.NET Entity Framework.
With ADO.NET DataReader, you can retrieve read-only and forward-only data from a database.
Discovering data access API calls can help your team:
- fix inaccessible databases or issues with the network library.
- solve your database and client software schema incompatibility.
- fix problems that occur when different ADO.NET components interact with one another or your own components.
- debug incorrect SQL, whether hard-coded or created by an application.
- adjust flawed programming logic.
What’s included in this quickstart?
The ADO.NET monitoring quickstart from New Relic provides immediate full-stack observability:
- Alerts (high load connection, hard connects exceeding max limit, pool size exceeding optimum limit).
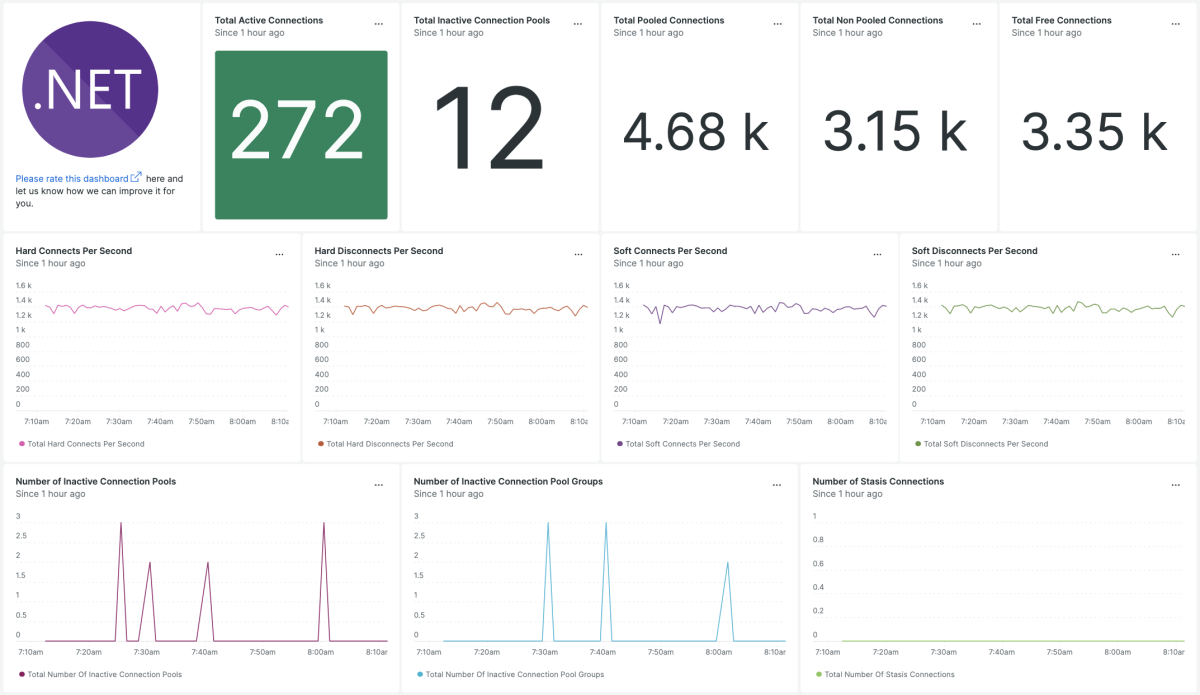
- Dashboards (hard connects per second, hard disconnects per second, number of active connections, soft connects per second and more).
- Alerts inform end users about the quality of their applications on a proactive basis.
- Monitor web transactions.
Comprehensive monitoring quickstart for ADO.net
When you monitor ADO.NET with New Relic, you can observe your ADO.NET data set in real time. Our .NET agent will also let you correlate transactions moving across your application environment and troubleshoot while working in a live development environment.
Need help? Visit our Support Center or check out our community forum, the Explorers Hub.

