As modern software and IT infrastructure environments become more complex and ephemeral, development and operations teams are finding it more difficult to speed development, optimize performance, and troubleshoot problems. It can be like trying to find a needle in a haystack… or in several haystacks!
Driven by new technologies and increasingly complex tools, from containers and orchestration to microservices and cloud computing, IT teams need to know what to alert on and how to set the right thresholds for those alerts. To help you address such issues and move faster with more confidence, we’ve implemented some amazing new intelligence features on top of our data platform.
At FutureStack18 in San Francisco, New Relic is thrilled to make available a trio of new features and initiatives that leverage our intelligence capabilities to solve meaningful customer problems in distributed and complex custom-application environments:
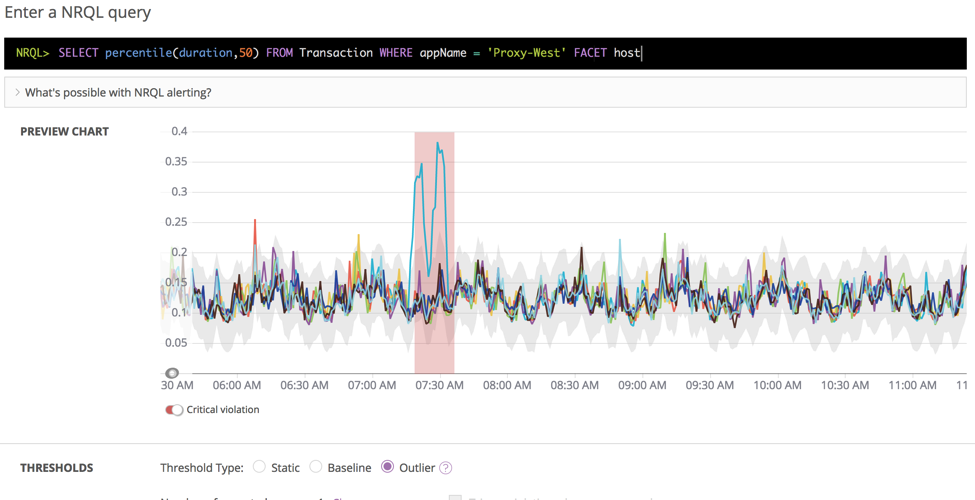
Outlier detection for NRQL conditions in New Relic Alerts. Outlier detection automatically detects when members of a group deviate from the norm.
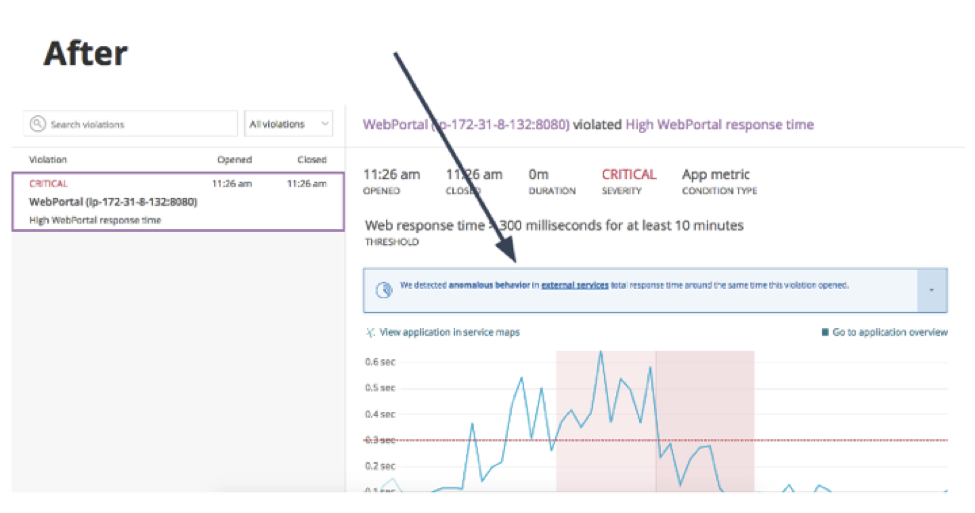
Incident context in New Relic Alerts. Dive into problems quickly by detecting and surfacing performance anomalies when responding to application alerts. Incident context shows you intelligent suggestions on where to start your incident investigation, speeding resolution.
Improved preview charts, a new NRQL condition UI, and support for the FACET keyword in NRQL condition queries. These three improvements make it easier to set alerting thresholds.
Outlier detection: get notified if members of a group deviate by a key metric
Outlier detection helps IT teams automatically detect misconfigured or misbehaving hosts and app instances. It also helps engineers determine when infrastructure operations and orchestration breaks down and when clusters, hosts, app instances, or pools of resources are not properly balanced due to one or more “bad actors.”
As you develop smaller, independent services running on increasingly ephemeral architectures, your environments become more complex, change more frequently, and require more orchestration to operate properly.
New Relic created outlier detection for New Relic Query Language (NRQL) conditions to help customers notify themselves of problems with their modern systems. Put simply, outlier detection watches the KPIs you’ve set for your clusters, and it surfaces issues in your systems so you can resolve them quickly and efficiently.
Customers using load balancers such as AWS Elastic Load Balancing or workload orchestration solutions such as Kubernetes or Apache Mesos often have groups of resources for which they want uniform performance. But what if the workload of a load balancer changes without notice? Outlier detection will notify you if members of a group deviate from a key metric by a specified amount for a specified period of time.
More specifically, imagine a DevOps team running 15 instances of an application to provide high-throughput services to its customers during business hours, with fewer instances needed after hours. The team needs to know if the error rates or transaction response for one or more instances differ significantly from how the other instances are performing. That difference could be due to changes to an app’s workload, a bad app instance, a host misconfiguration, or a hardware issue—any of which may need immediate attention.
Outlier detection supports multiple groups in one condition, so if your data naturally falls into multiple clusters (perhaps older servers using more CPU power than newer servers) you can track these groups separately in a single condition. This lets you define more sensitive thresholds and manage fewer conditions. In addition, if you’re tracking multiple groups, you can set optional triggering criteria to fire if any of the groups collide or if one of the expected groups goes missing. Use this option for edge cases where you want to keep groups separate and also want to make sure a certain number of groups are always present.
To use outlier detection, you enter the number of groups you see in the data, and New Relic uses a clustering algorithm to automatically detect those groups. You then set a divergence threshold and a duration, and New Relic watches those groups minute by minute. When members of a group stray too far for too long, the condition triggers and New Relic sends an alert that it has detected an outlier.
Outlier detection is automatically enabled for customers with a Pro subscription or higher. It requires data that can be queried via NRQL (from New Relic APM, New Relic Browser, New Relic Infrastructure, etc.). For more information, check out the New Relic documentation.
Incident context: get help fixing stuff when it breaks
In today’s complex distributed systems, some level of failure is often the norm—not an isolated, uncommon occurrence. Instead of completely stamping out failures, the modern goal is to build resilience to reduce the overall number of failures and speed up mean time to resolution (MTTR) to minimize the impact of inevitable issues.
That’s important, because when an on-call engineer gets paged at 3 a.m., it can take a while to identify where to look for the problem, determine the blast radius, and figure out if an affected service is part of the causal chain of the incident or just a victim. Deciding where to start looking often involves a whole lot of guesswork—not the least of which is determining which team is responsible for solving the problem.
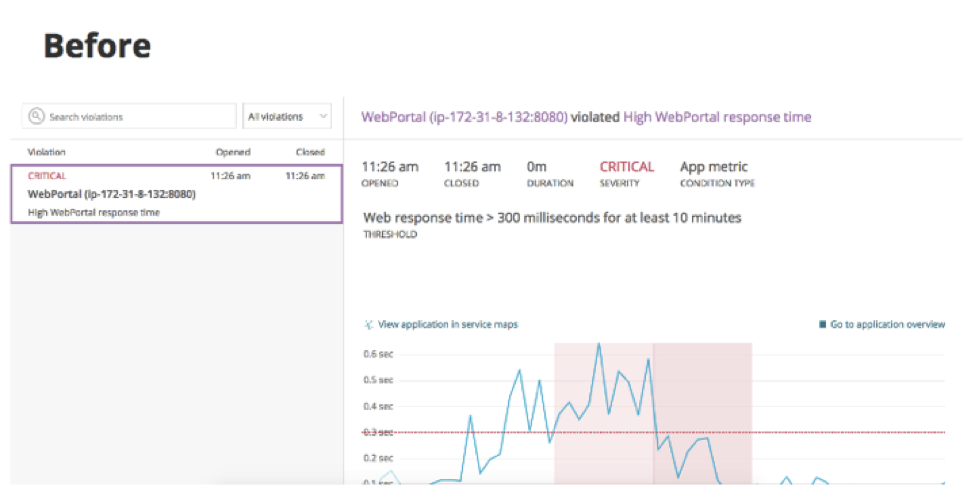
Incident context speeds troubleshooting during an incident by giving customers proactive, intelligent, and seamless assistance at the start of an incident. With incident context, engineers can more quickly know where to start their investigation into the chain of events that led to an alert. Specifically, it reveals anomalous behavior on signals associated with the application that triggered the alert.
New Relic runs a change-detection algorithm and shows any anomalies inside the incident overview page. We compare the behavior during the time period of the alert violation with the previous six hours (minus the duration of the incident) to highlight unusual spikes. For example, if you’ve set an alert policy for error percentages on an application above 5% for 5 minutes, New Relic would run a comparison between the 5 minutes immediately before the violation with the previous 5 hours and 55 minutes of behavior:
 Incident context is automatically enabled for all customers with a Pro subscription or higher.
Preview charts, new NRQL form, and FACET support
In addition to outlier detection and incident context, we’ve recently released several new intelligence capabilities designed to help our customers manage their complex systems and help you make better, faster decisions.
In April 2018, we released preview charts. When you create conditions in New Relic Alerts, this tool lets you see time-series charts of the signal for which you are creating the condition. That makes it easier to choose an appropriate alert threshold.
In May, we improved NRQL alert creation. We combined NRQL static thresholds and NRQL baseline conditions into a single form. You can now change a NRQL alert condition from from static to baseline without having to rewrite the NRQL query. One less task for you to worry about!
Also in May, we added support for FACET keywords. FACETed NRQL alerts make it easier than ever to monitor dynamic and ephemeral KPIs. Specifically, NRQL conditions using static thresholds now support the use of the FACET keyword when the number of facets is 150 or fewer. You can learn more in the New Relic documentation.
Because of the breadth and depth of the data New Relic helps you collect, we’re uniquely positioned to deliver best-in-class intelligence capabilities. The new features and tools described in this post should give you an idea of how New Relic is working to help you leverage intelligence to better manage today’s increasingly complex systems and save toil.
本ブログに掲載されている見解は著者に所属するものであり、必ずしも New Relic 株式会社の公式見解であるわけではありません。また、本ブログには、外部サイトにアクセスするリンクが含まれる場合があります。それらリンク先の内容について、New Relic がいかなる保証も提供することはありません。


