The following is adapted from a series of best practice guides that reflect the New Relic Community Team’s work with thousands of customers—identifying challenges and coming up with actionable solutions for organizations getting started with New Relic Mobile. Also, check out our guides to getting started with New Relic APM, New Relic Insights, New Relic Browser, New Relic Infrastructure, and New Relic Synthetics; and discover the New Relic Community Team’s latest Best Practice Guide offerings.
Your customers expect your mobile applications to work—all the time, every time. That means you need the ability to uncover any mobile performance issues in real time, to understand how these issues impact your customers, and to find and fix the problems quickly in today's increasingly complex mobile-app architectures.
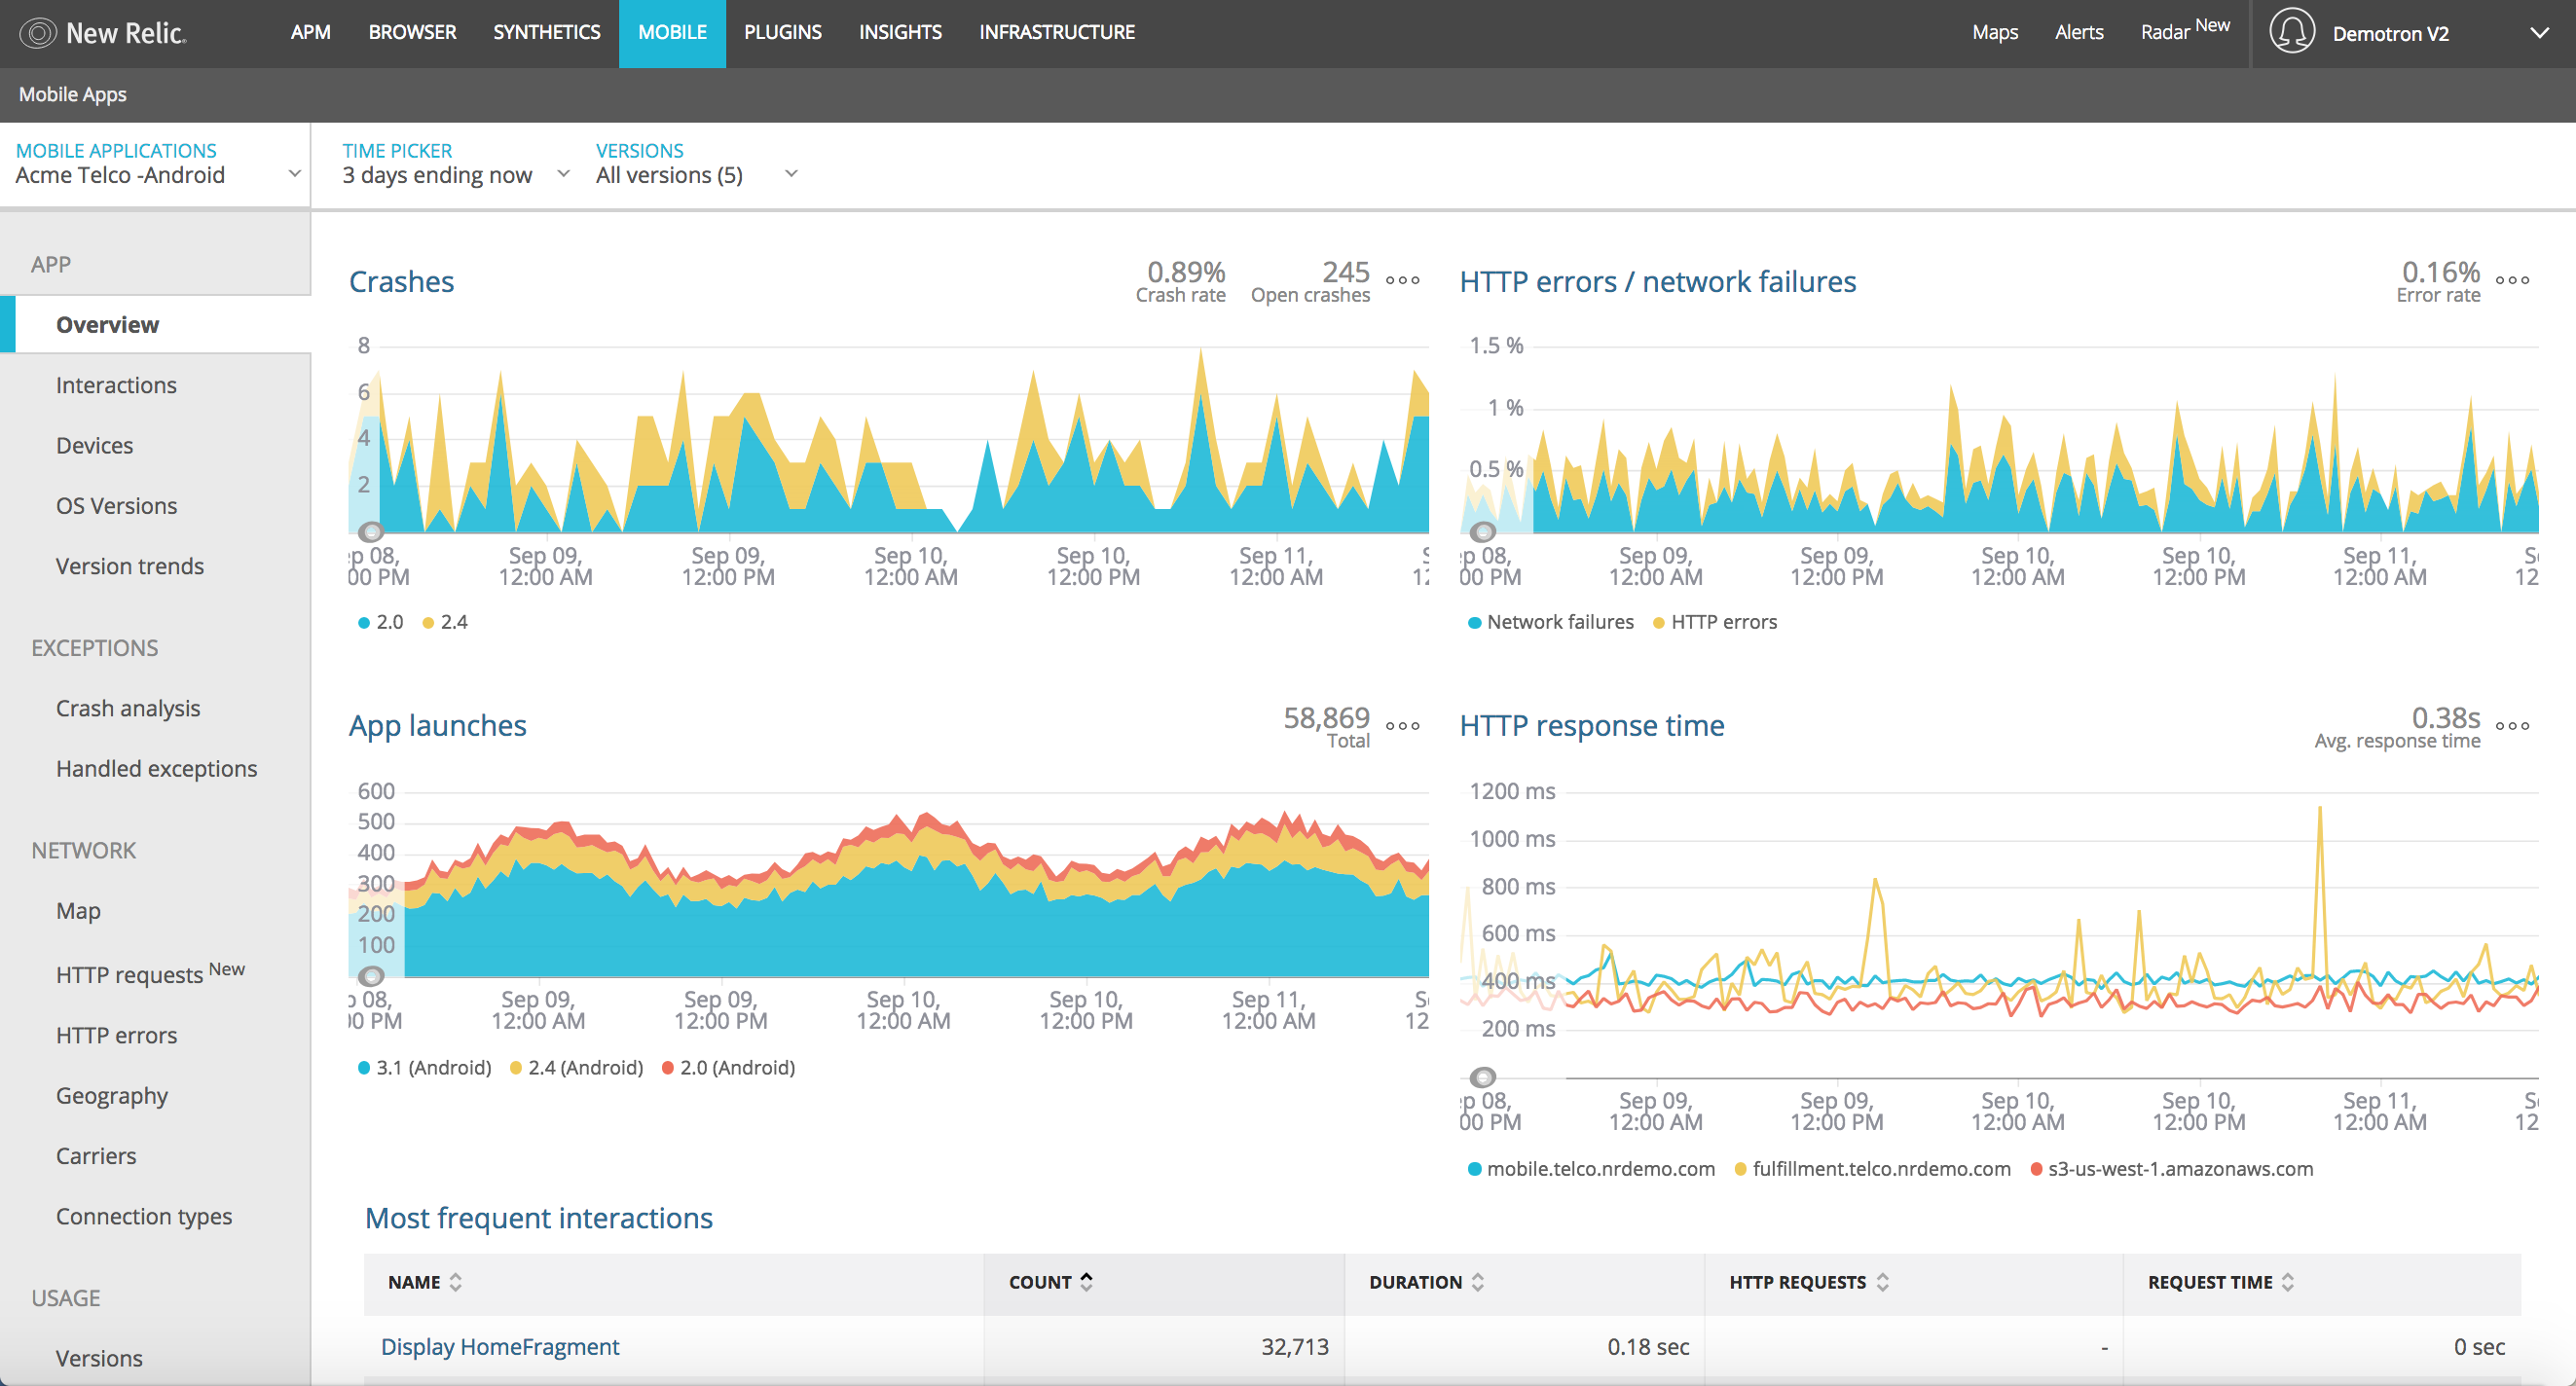
New Relic Mobile gives you these abilities. It allows you to monitor and manage your iOS and Android applications by providing detailed end-to-end performance data, by identifying and tracing errors, and by analyzing app throughput—in real time. And New Relic Mobile helps you understand app performance through the eyes of your users by providing code-level visibility into user interactions.

There’s a lot of power in these capabilities, and sometimes this power can feel overwhelming: How do your teams know where to begin working with New Relic Mobile? How can you turn the insights it gives you into action? This list of tips and best practices is a great place to start.
(If you’re completely new to the New Relic platform, we suggest starting with this primer and series of short videos that offer New Relic a quick but thorough introduction to our family of products, the technology that powers them, and their place in modern software development.)
Tips to organize and optimize New Relic Mobile
Create a naming schema for your mobile apps
Many organizations maintain an entire collection of mobile apps—each potentially with multiple versions and support for multiple devices and operating systems. When developers assign arbitrary and non-descriptive names to apps, it can make the issue resolution process more difficult and time-consuming than it needs to be.
The best way to avoid this problem is to use a clear and consistent naming scheme for your apps. For example:
OS Type (iOS/Android) - AppName - Environment (Prod/Dev/QA/Staging)
This gives you a unique and descriptive name, such as:
Android-SuperCoolApp-Prod
Next steps: Learn how to customize your New Relic Mobile app settings to change a mobile app's name, update its alert conditions and make other adjustments.
Keep your New Relic Mobile agents up to date
Mobile technology changes fast—so we continually update the New Relic Mobile agents to keep pace with these changes. The updates contain bug fixes and new features that can make a major difference in your ability to spot and fix issues with your mobile apps. The updates can also improve the quality and reliability of your New Relic Mobile reports.
One of the first steps to take when troubleshooting an app is to check the version of the Mobile agent running on your system and make sure that it is up to date.
Next steps: Learn how to use a simple New Relic Query Language (NRQL) query to check the version of the Mobile agent running on your systems. It's also useful to review the Android agent and iOS agent release notes to understand what has changed from one release of New Relic Mobile to the next.
Understanding your New Relic Mobile data
Learn how to interpret crash reports
A mobile app crash report isn't useful unless it's presented in a way that humans can easily understand and analyze. In many cases, however, the debug symbols required to produce human-readable crash reports have been stripped from an app binary—either to reduce the file size or to deliberately obfuscate the code.
New Relic Mobile helps developers perform a process known as "symbolicating" crash reports: supplying the debug symbols that can de-obfuscate and translate a crash report from a list of memory addresses back into human-readable form. It does this by applying either a dSYM file (for iOS apps) or a Proguard/Dexguard mapping file (Android) to the crash report.
Next steps: Learn how to use a dSYM file to symbolicate your iOS crash reports with New Relic Mobile and begin the app troubleshooting process; and learn how to load a mapping file to symbolicate your Android apps.
Find third-party service slowdowns
Mobile apps often depend on multiple APIs and external services—for example, apps that integrate third-party authentication services, social-sharing options, or location services with a tool such as Google Maps. These services are often useful, or even essential, but they also represent points of vulnerability—especially when a third-party service slowdown creates performance issues for your app, as well.
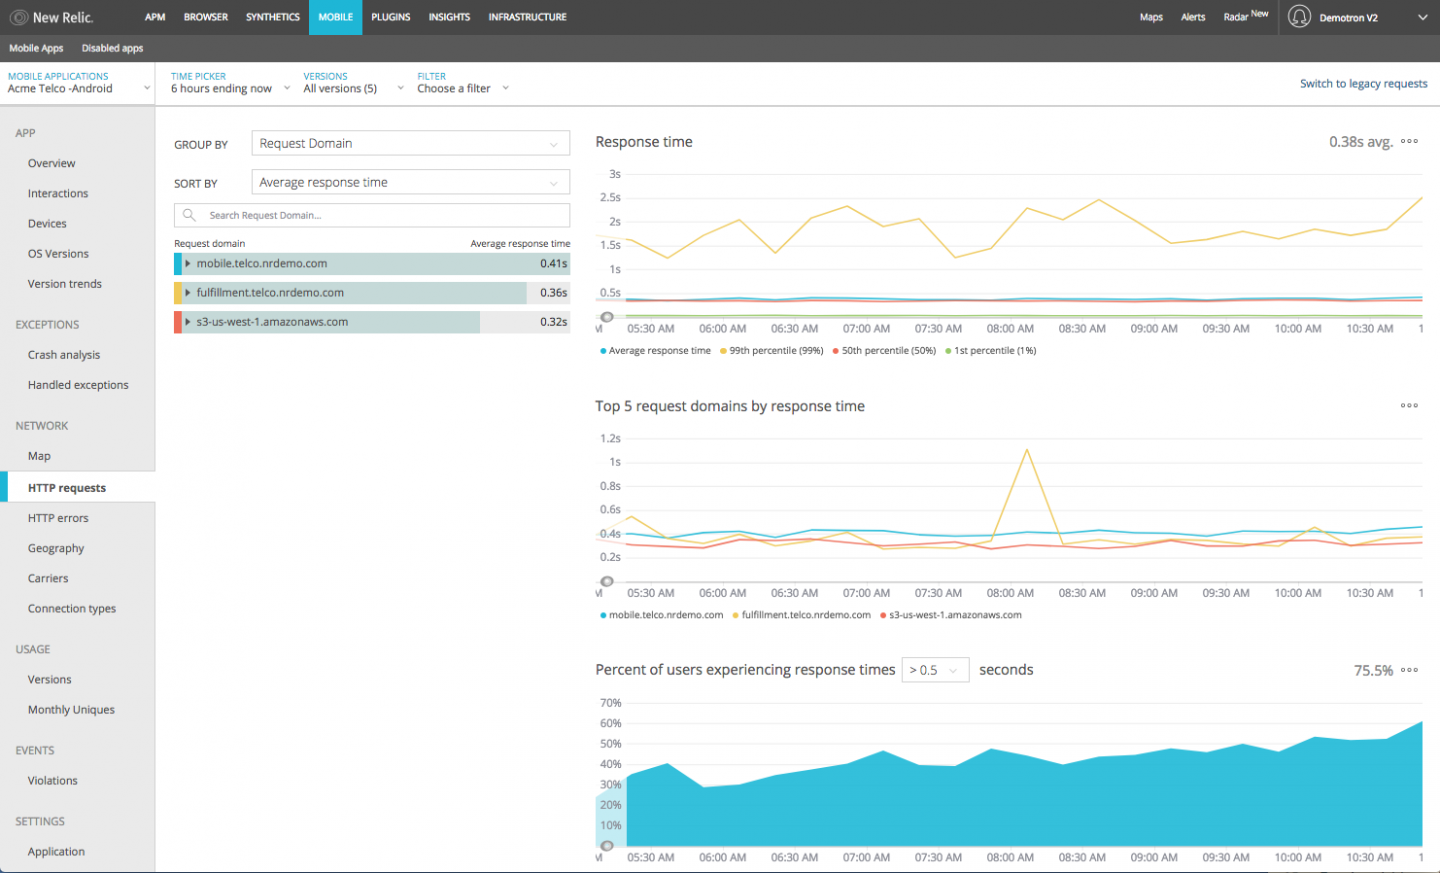
New Relic Mobile helps you to diagnose and deal with these third-party performance issues. Using the HTTP requests page in New Relic Mobile, you’ll see a breakdown of the requests being made in your app, along with other options to analyze the performance of these requests.
Next steps: Learn how to find and use the HTTP requests page in New Relic Mobile, where you'll also find ways to look for trends in the HTTP analysis charts, and to target specific request and response attributes by grouping, sorting, and filtering the data.

Take action with your New Relic Mobile data
Capture custom data
The New Relic Mobile agent captures a wide variety of data by default—you can see a list here. New Relic Mobile also supports the use of custom data types, including custom events: data about arbitrary user activity that is collected as a user navigates through your mobile app. You can then leverage this user activity to trigger other types of data collection—a flexible framework with virtually limitless uses.
Next steps: Learn more about adding custom data to New Relic Mobile—including session-level custom attributes, custom breadcrumbs, and custom interactions, in addition to custom events. Also, learn more about when to use custom attributes or custom events as the best option for a given instrumentation scenario.
Trace crashes with the event trail and breadcrumb events
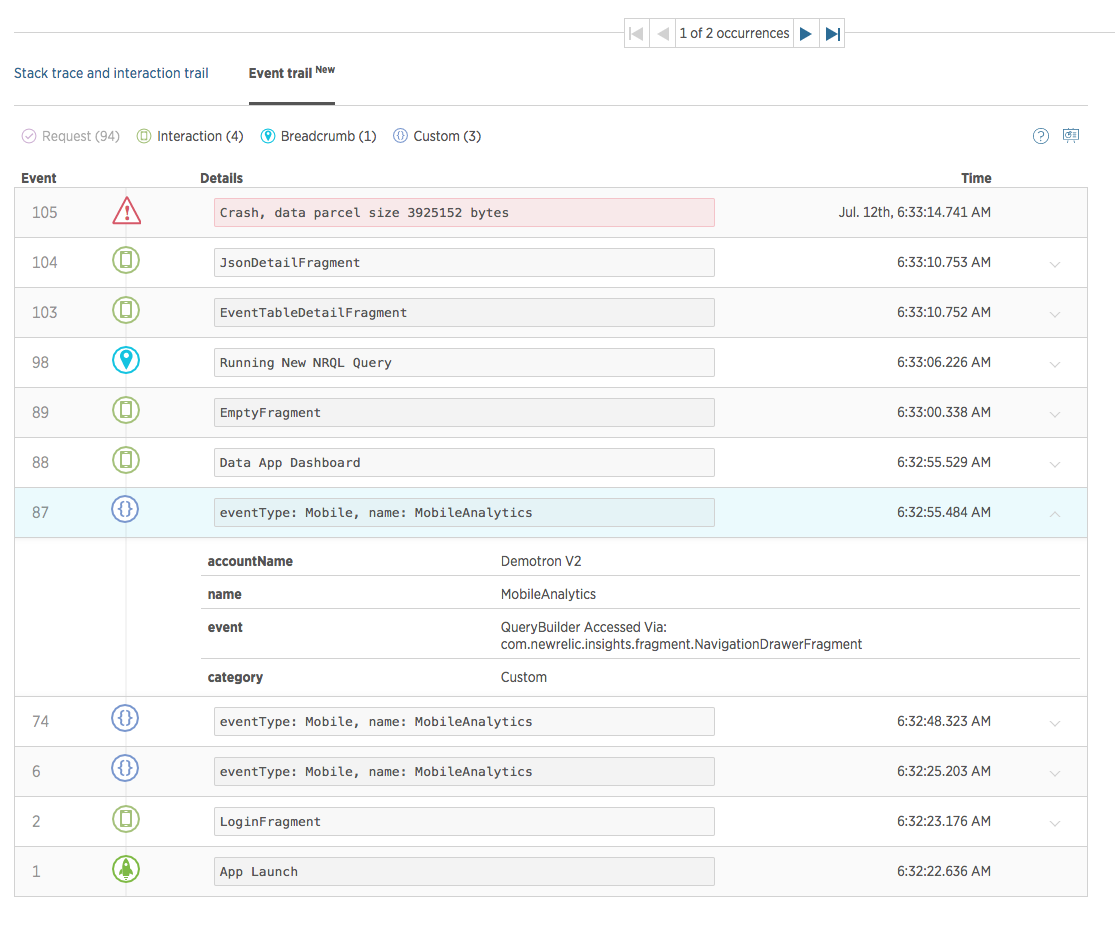
Sometimes you have to understand the customer’s path through the application to know why a crash happened. The New Relic Mobile crash event trail does this for you—showing you the events leading up to a crash, whether these involve events that New Relic monitors by default or custom events created using New Relic Insights.
You also can select any further breakpoints for monitoring, such as breadcrumb events. These show up in the event trail to help you more quickly troubleshoot your app crashes.

Next steps: Learn more about using the event trail and breadcrumbs in New Relic Mobile to track down and fix the root sources of app crashes.
Ready to learn more?
Looking for more New Relic Mobile best practices and tips? Check out the Mobile Level Up category here.
Also, remember that when you're ready to show off your new skills, be sure to take the New Relic Mobile Best Practices Quiz and earn your proficiency badge!
本ブログに掲載されている見解は著者に所属するものであり、必ずしも New Relic 株式会社の公式見解であるわけではありません。また、本ブログには、外部サイトにアクセスするリンクが含まれる場合があります。それらリンク先の内容について、New Relic がいかなる保証も提供することはありません。


