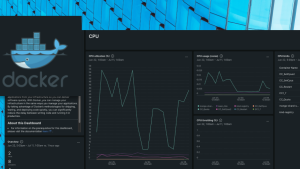
Today we’re announcing the integration of Azure Machine Learning with New Relic to help you monitor your machine learning (ML) workspaces, endpoints, and deployment-related metrics, and the availability, performance, and resource utilization of your ML resources. The integration gives you pre-built visualizations and allows you to troubleshoot ML-related issues alongside other infrastructure and application telemetry in one unified dashboard.
The new integration allows you to:
- Keep track of ML workspaces by collecting data on all workspace activities, including quota details.
- Monitor the performance of ML endpoints by gathering metrics on their operational efficiency.
- Get oversight of ML endpoint deployments.
- Get visibility of important performance metrics using a pre-built dashboard that includes job executions, model metrics, quota metrics, online endpoints, and endpoint deployments, as well as CPU and GPU usage per workspace.
- Customize alerts to suit your specific needs.

Visibility into job executions

Available and used quota information for a model
The two screenshots above show how comprehensive the new integration’s dashboard is, which includes a number of tabs that provide detailed views of model metrics, CPU and GPU usage per workspace, and endpoint-specific resource utilization metrics.
In addition to the new dashboard, workspaces and endpoints are captured in the entity explorer view, providing information about deployment details, endpoint-specific traffic, and latency. The integration also offers logs monitoring of Azure Machine Learning models in New Relic, capturing such details as container name, container image name, and information about Azure Machine Learning resources.
次のステップ
To monitor Azure Machine Learning with New Relic, visit our docs, deploy the quickstart dashboard, or sign up for a free account (100 GB/month of free data ingest, one free full-access user, and unlimited free basic users).
本ブログに掲載されている見解は著者に所属するものであり、必ずしも New Relic 株式会社の公式見解であるわけではありません。また、本ブログには、外部サイトにアクセスするリンクが含まれる場合があります。それらリンク先の内容について、New Relic がいかなる保証も提供することはありません。


