During the last decade, New Relic has faced some of the same software development challenges that many of our customers face today. One of the most interesting—and most difficult—of these challenges involved ramping up the frequency of our releases without compromising quality. Solving this challenge was essential to continuing to accelerate development at scale.
In a recent webinar, Best Practices for Measuring Your Code Pipeline, we examine the solution to this challenge: using instrumentation to automate and accelerate the code pipeline while increasing the quality of deployments and of the overall development process. We also look specifically at how the New Relic platform gives you the measurement, monitoring, and alerting capabilities to push changes to production more frequently and with less risk.
Go faster—or go home
As New Relic Senior Solutions Manager Tori Wieldt explains in the webinar, New Relic's approach to this topic isn't simply a sales pitch. It reflects our own moment of truth: Breaking free from a legacy, monolithic architecture that was limiting growth and burdening developers with unnecessary toil and risk.
"We had the siloed teams, we were not releasing as frequently as we liked, and we were very reactive in our thinking," Wieldt says. "We realized that we had to change. We weren't going to be successful unless we changed our architecture and changed our processes."
"Now, we are running over 200 microservices," Wieldt continues. "We have 50-plus engineering teams. We regularly deploy our software between 20 and 70 times a day, and the teams are proactively watching what they deploy."
As Wieldt points out, however, while it was necessary for New Relic to adopt a microservices architecture and DevOps methodologies to accomplish its transformation, none of it is sustainable without another, critical capability: Building a process that can move dozens of code commits per day from a source code repository, through the build-and-test process, and into production deployment—without impacting quality or adding risk to the development cycle.
"How are you going to automate your code pipeline?" Wieldt asks. "As you move from continuous integration to continuous deployment, you want to get the code out there as quickly as possible, but if you're not delivering quality software, then it defeats the purpose."
The right kind of monitoring for pipeline quality and performance
Measurement and monitoring, of course, is a must-have capability for moving faster while maintaining quality. But as Wieldt points out, being able to "move quickly with confidence" requires a specific approach to measurement and monitoring—one that gives an organization visibility into its full stack, rather than focusing on a particular pipeline stage or platform.
Watch the full half-hour webinar video below for a hands-on demonstration of how monitoring can improve your code pipeline velocity and performance. Or read on to discover highlights and best practices discussed during the webinar.
Speed and quality: Do both, or don't do them at all
"These changes are coming much more quickly" as a team accelerates its deployment cycle, Wieldt notes. "How do you identify [the impact of] changes you introduce both at the infrastructure level and the application level? Is it making the user experience better or worse? Are people getting what they need? Are they seeing errors? Is it taking a long time to load things?"
As the development cycle accelerates, she continues, and as microservices environments grow in size and complexity, measurement tools that yield meaningful answers to these kinds of questions, and that allow developers to identify and fix issues efficiently, will make or break your ability to deliver quality code. And as Wieldt notes, in today's business environment, low-quality software is a self-defeating outcome no matter how quickly you produce it.
A live look at pipeline monitoring and measurement
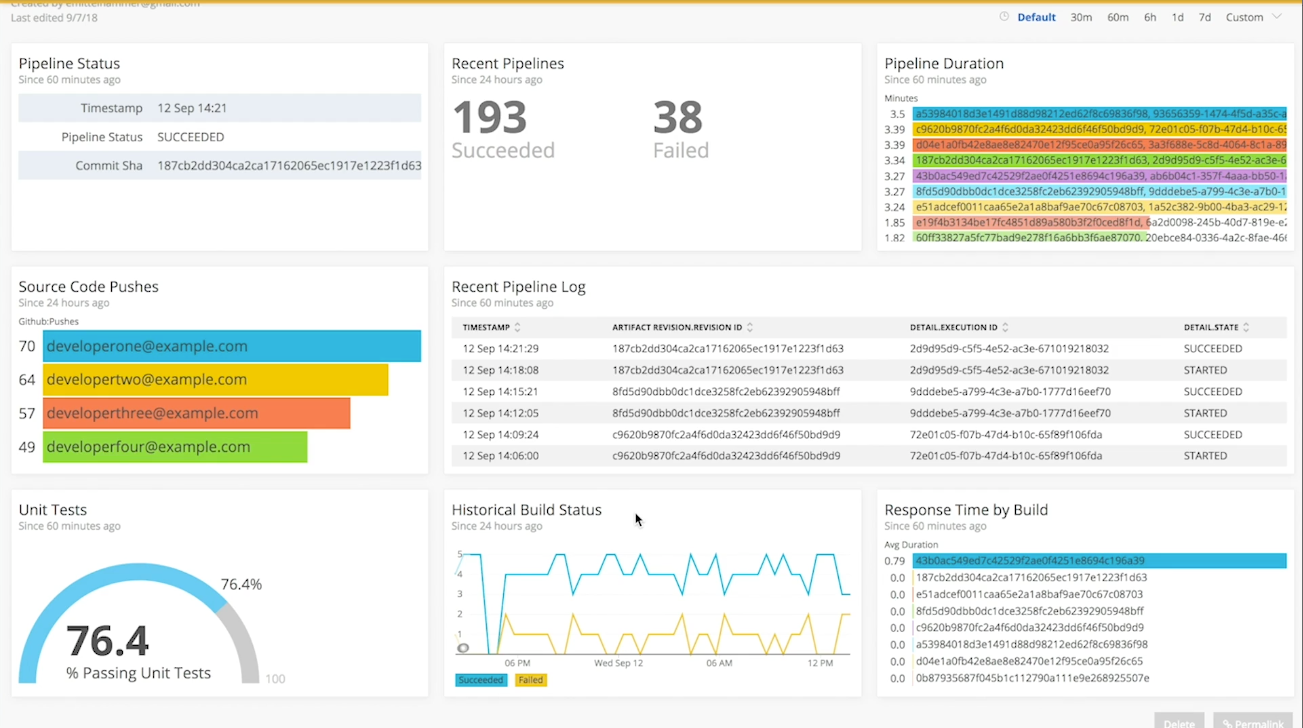
Of course, the best way to explain best practices for monitoring a code pipeline is to apply them to a live, functioning pipeline. That's exactly what Wieldt and New Relic Solutions Consultant Eric Mittelhammer do during the webinar.
Mittelhammer started by reviewing the general definition of a code pipeline. "Essentially, there are tools that manage the progression of states of an application from its source code to deployment," he says, citing AWS CodePipeline, CircleCI, and Jenkins as popular examples. While the internal details vary from system to system, he adds, any code pipeline will include the same elements and functions—moving code from a source repository, through the build and testing process, and finally into production deployment.
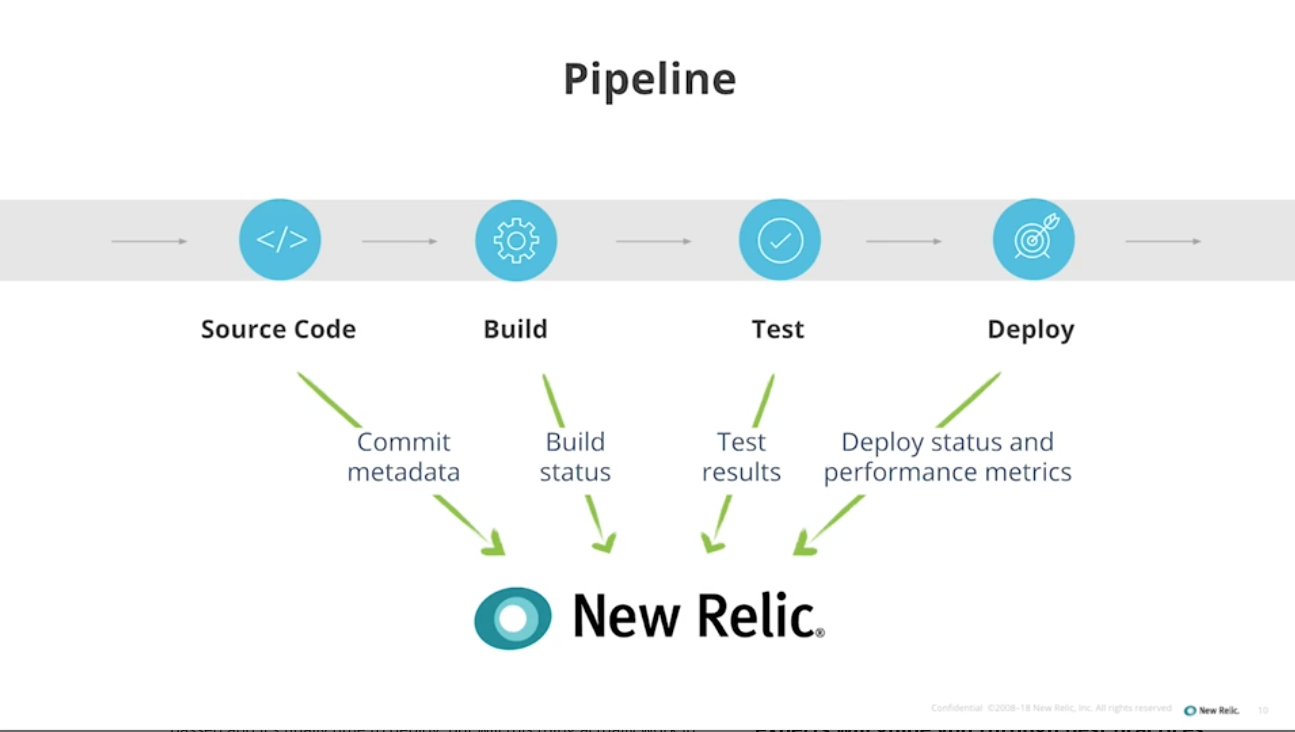
As code moves from one state to the next in a pipeline, it generates data that New Relic and other monitoring tools can collect, analyze, and use to extract a variety of insights. Of course, the best way to illustrate this is actually to do it—which is exactly what Mittelhammer demonstrates:
"We have a live, running code pipeline—active commits that are triggering builds and deploying a tiny node.js app that I've built," Mittelhammer explains. "I'm going to show you what data you want to collect from your pipeline, as well as how that augments the data that you're already getting from your application. We're going to show you how to send that back to New Relic, and then how to create dashboards" that a team can use to diagnose and troubleshoot issues, and to communicate with other stakeholders in the development process.
Getting results from pipeline measurement: 4 best practices
Whether a team uses New Relic or another monitoring solution, Mittelhammer says the same guidance applies to monitoring a code pipeline in order to get timely and useful insights:
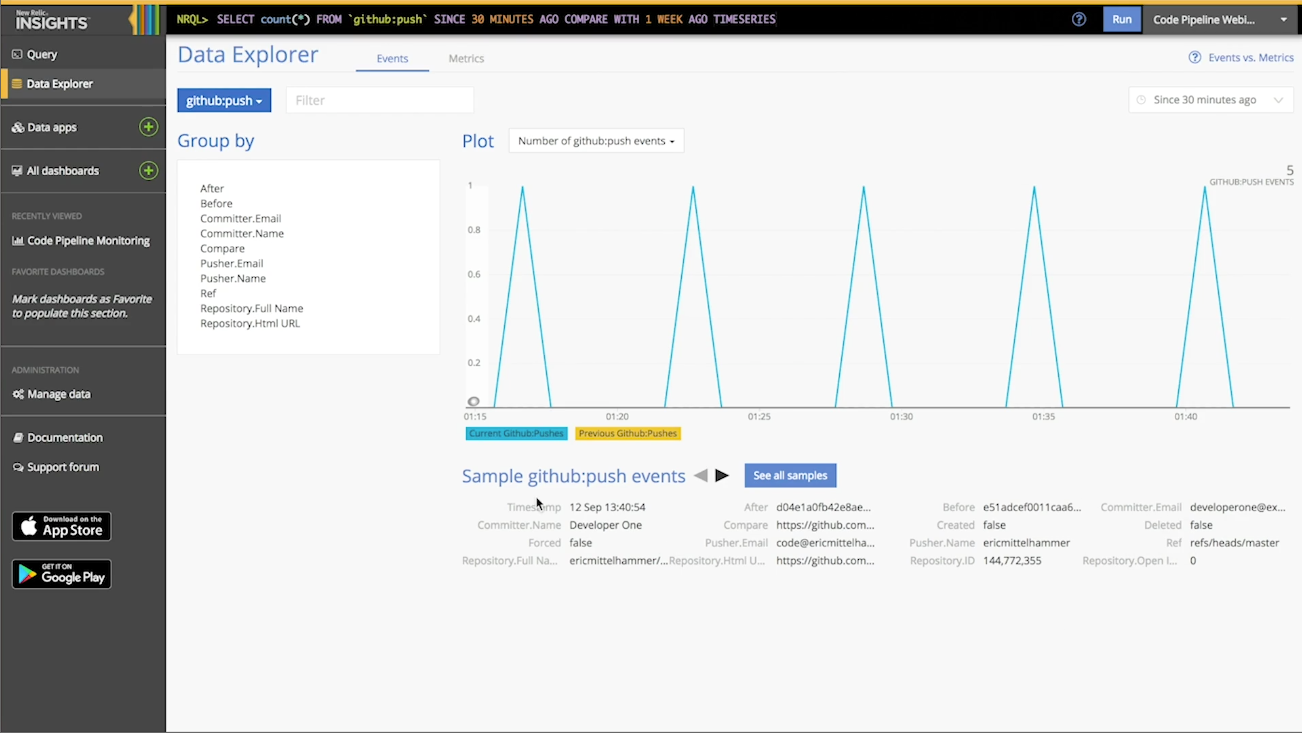
1. Everything starts with source-code management. Capturing timestamped state changes to your pipeline, Mittelhammer says, is critical to analyzing your pipeline performance and especially to troubleshooting source code errors.
"At least you want to get the author and the ID that designates a change in GitHub" or any other source code management tool, he says. Using New Relic APM 360, it then becomes possible to "tag" an application with the build ID and source code revision.
"As you ... profile other parts of your application and you start to build out dashboards ... you can see how every single source code change affects it, and you can trace it back to the source," Mittelhammer explains. That's a useful capability for any team, but it's especially powerful for teams that may deploy dozens or even hundreds of times per day.
Going deeper into the data at this stage can yield some interesting insights, Mittelhammer adds. A dashboard can display a variety of metrics derived from source code repository metadata such as number of source code pushes per developer, lines of code pushed to particular apps, and number of lines changed in a given app's source code, among many other possibilities.
2. State changes are useful metrics for process improvements. "Whenever a stage starts or finishes, you want to capture not only the fact that it did start or finish, but also the status: Was it successful? Did it succeed or fail?" Mittelhammer asks. This data often feeds metrics that a team can track against internal goals and process assessments—for example, increasing deployment frequency or build quality.
3. Report the results of unit tests—and then go deeper. Unit test results are obviously a good target output source for New Relic. Pass/fail results give you a handle for assessing real-time pipeline performance, and they're also useful tools for assessing and improving a development team's growth and progress over the longer term.
It's also useful, Mittelhammer says, to once again look deeper into the pipeline metrics at this point—for example, using qualitative metrics such as code coverage to set and track more in-depth performance goals. And while the example node.js app used in the webinar doesn't actually compile, code that does require compilation will obviously generate yet another set of metrics that New Relic can collect, analyze and correlate as needed.
4. Successful deployments can tell you even more than failed ones. Mittelhammer explains how to record successful code deployments using New Relic's APM REST API—and why this can be extremely useful to track.
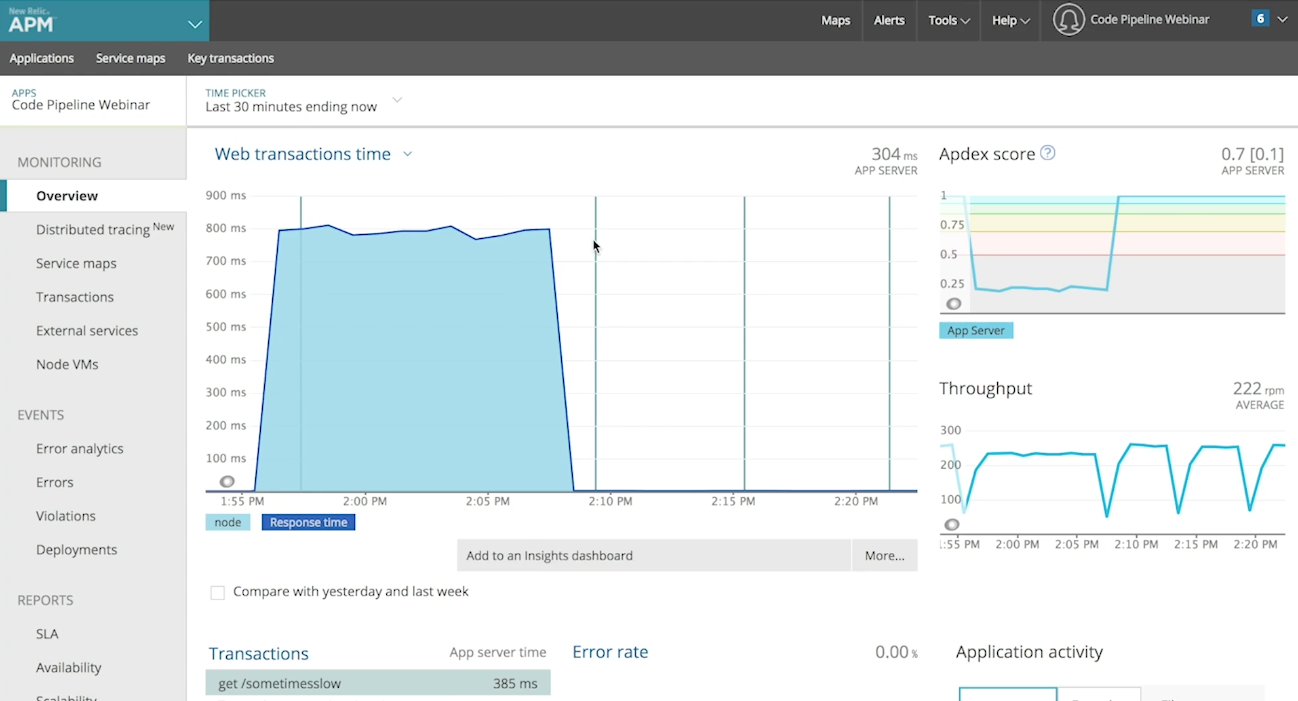
Using deployment markers in conjunction with application performance data, he says, can show some obvious and important correlations. "You'll see that one build is taking longer than the others ... and a direct correlation to a particular deployment that caused a performance degradation," Mittelhammer says. "You can use those deploy markers to trace back to the exact change that caused the degradation," and teams can also configure alerts for real-time notification when such correlations occur.
Learn more—and try it yourself
Clearly, there's a lot you can do to apply monitoring, and especially the New Relic platform, to gain visibility and control over your code pipeline. The webinar offers a more detailed discussion, and you can download the full source code and documentation, so that you can set up, repeat, and customize the demo to suit your needs.
Finally, if you'd like to see how one New Relic customer applied lessons learned from this webinar to create its own custom measurement solution, be sure to check out our in-depth look at How the SMART by GEP Team Monitors Its Code Development Pipeline with New Relic. It's a great follow-up to the webinar—demonstrating just how a smart monitoring strategy can turn your code pipeline into an engine for growth and performance.
本ブログに掲載されている見解は著者に所属するものであり、必ずしも New Relic 株式会社の公式見解であるわけではありません。また、本ブログには、外部サイトにアクセスするリンクが含まれる場合があります。それらリンク先の内容について、New Relic がいかなる保証も提供することはありません。


