The following is adapted from a series of best practice guides that reflect the New Relic Community Team’s work with thousands of customers—identifying challenges and coming up with actionable solutions for organizations getting started with New Relic Browser. Also, check out our guides to getting started with New Relic APM, New Relic Mobile, New Relic Insights, New Relic Infrastructure, and New Relic Synthetics; and discover the New Relic Community Team’s latest Best Practice Guide offerings.
New Relic Browser is designed to be your first, and quite possibly your biggest, step toward understanding how your site’s performance impacts your customers. Whether you’re looking for improved insights into AJAX performance; trying to monitor, diagnose, and fix issues with a single-page application (SPA); working to untangle JavaScript errors; or performing a range of other tasks, Browser is packed with capabilities that help you deliver great digital customer experiences.
In this guide, we’ll offer our most popular and useful tips for working with New Relic Browser. In particular, we’ll help you understand some key data resources you’ll encounter while using Browser and offer tips for how you can transform this data into actionable performance insights. We’ll also point the way to documentation and other resources you can use to continue your path to mastery with Browser and other New Relic applications.
(If you’re completely new to the New Relic technology landscape, we suggest starting with this primer and series of short videos that give New Relic novices a quick but thorough introduction to our platform, the technology that powers it, and its place in modern software development.)
Getting started with New Relic Browser: organizational tips
Work smarter with a naming convention!
When multiple applications run on the same account, and each application spans multiple environments (for example, development, test, pre-production, and production), it can be hard to find a specific application in your overview dashboard.
We recommend establishing a naming convention for your apps and using labels to facilitate search and filter tasks. Use a naming convention like <environment>-<appname>-<language> to spot patterns in your data more easily.
Learn more about application naming conventions, including how to rename your apps, in our guide to renaming Browser apps. Our blog post, “What’s in an App Name? How to Create an App-Naming Convention,” includes tips that can improve the way your team monitors all of its applications with the New Relic platform, especially in large deployments.
Link APM and Browser apps for end-to-end visibility
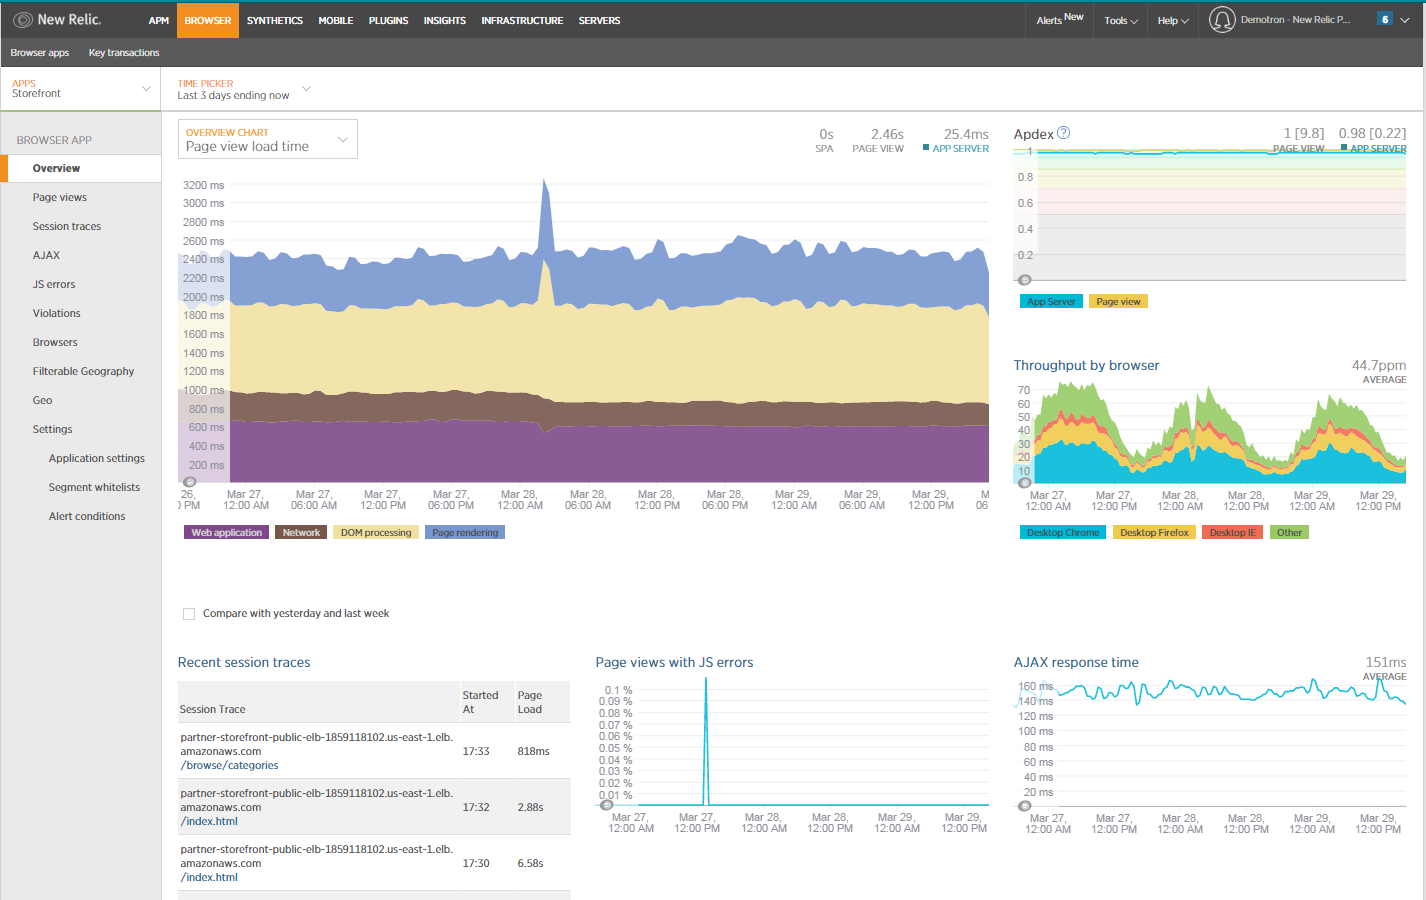
When a user sets up a Browser app, either using APM app auto-instrumentation or the copy/paste method with a Browser JS snippet, they get the ability to link to an APM application. This makes it possible to observe your site's frontend performance statistics in relation to its backend performance. This is important because a problem in front-end performance may be caused by a back-end issue—and by linking apps, you get end-to-end visibility into such issues.
We prefer that you create these links using the auto-instrumentation option in your APM app environment. For the copy/paste method (which can be useful for monitoring static sites or cached pages delivered by CDN), you’ll need to select the related APM app in the setup page. Then, from either the APM or Browser overview page, simply click the button above the response time chart that provides a direct link to the other back/frontend overview.
Learn more in our New Relic Browser documentation about setting up and using APM auto-instrumentation, as well as the copy/paste method, to link your Browser and APM apps.
Understanding your New Relic Browser data
Use Session Traces for context around website user behavior
Every user visit to your site is tracked as a session, and Browser captures some of those as detailed session traces. Session traces provide a detailed timeline of events, for up to 10 minutes, providing vital context into a user’s activities, and in many cases making the process of diagnosing and fixing problems faster and easier.
Learn more about using session traces to explore the load and interaction events that represent the life cycle of a webpage.
Diagnose performance problems with AJAX requests
New Relic Browser tracks AJAX requests in your webpage to help you identify slow calls to external endpoints. This is a helpful tactic for troubleshooting performance problems: It allows you to determine whether a call to a particular third-party site is responding slowly, which in turn can tell you very quickly whether your own site or a third-party site is the source of a performance problem.
Learn more about using AJAX requests to identify and diagnose time-consuming third-party website calls.
URL whitelists: Discover the power of grouping browser metrics
By default, New Relic will analyze Browser pageview metrics as it receives them. URL grouping can be done automatically, based on New Relic Browser's analysis of the website's URL space. This results in URL patterns such as www.foo.com/users/*/profile, which omit the varying user ID parameter and group similar "user profile" page views together.
You can create your own URL groups to capture those parts of the URL that are similar across many different individual page views. This also provides information about the code path that generated the URL's content.
Learn more about creating, using, and managing whitelists in New Relic Browser, including how to create rules-based whitelists.
Using Browser to make your data actionable
Use NRQL queries to get the most from your Browser data
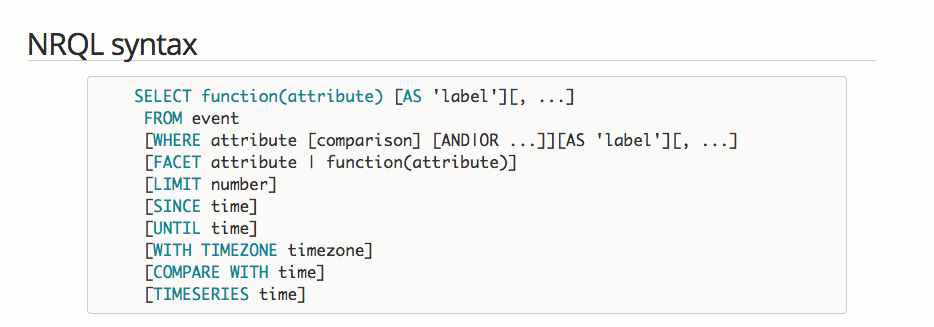
New Relic Insights brings all of the data generated from your New Relic applications together in one place, and it provides a powerful set of tools to analyze and query your data. Perhaps the most powerful of these tools is New Relic Query Language: a query language, similar to SQL, used to make calls against the Insights event database.
NRQL is essentially a language used to ask questions of your data (and to understand the answers). A simple NRQL query, for example, can be structured to find your slowest or most frequently visited pages.
Working with NRQL in conjunction with Browser or any other New Relic product is necessarily a very big topic. The Level-Up posts below offer a good starting point for exploring the possibilities—focusing on how to set up Insights dashboards that you can use to visualize the results of NRQL queries and to get meaningful insights from your Browser data:
- Insights Dashboard for Browser: Part 1 - Users
- Insights Dashboard for Browser: Part 2 - JS Errors
- Insights Dashboard for Browser: Part 3 - Ajax Request
Use Browser sourcemaps to decode minified JS errors
JavaScript error analysis is another popular and very effective way to use New Relic Browser to understand your website users’ experiences—giving you the visibility required to find and fix JS errors that may expose users to annoying performance and functionality glitches
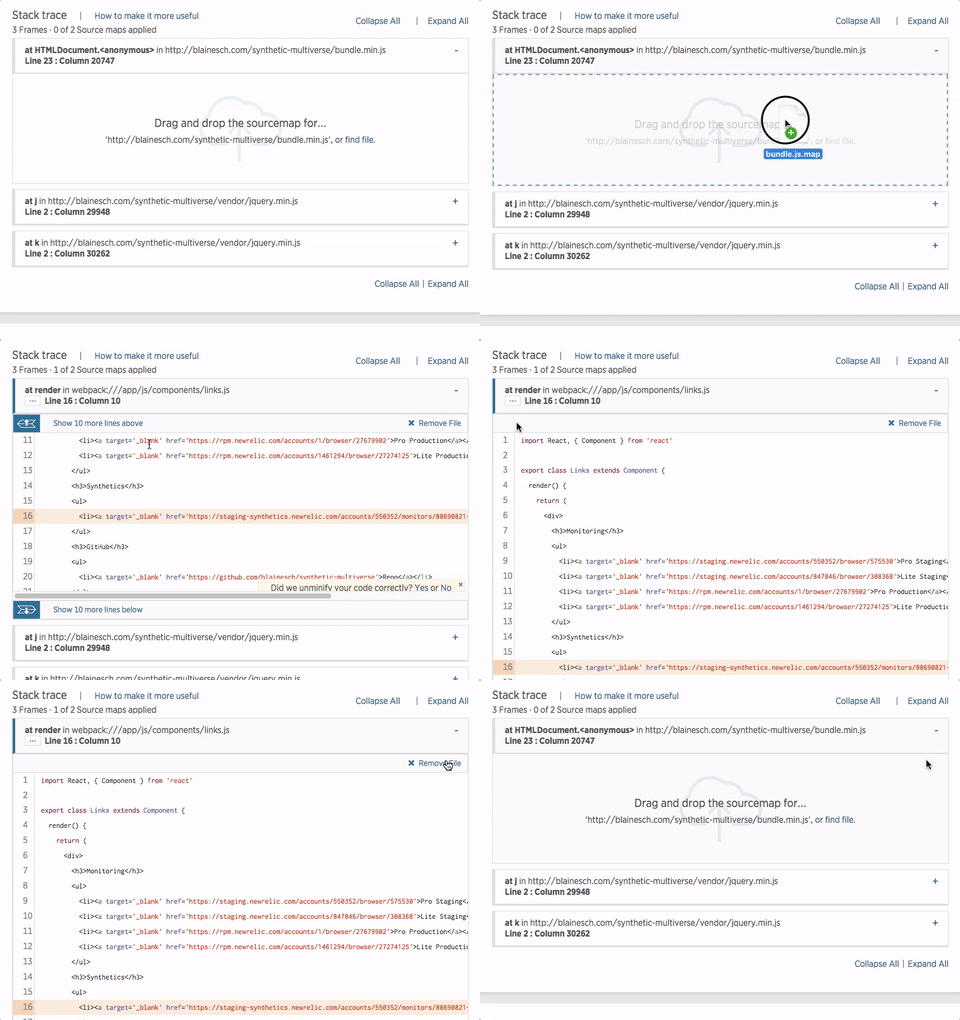
The process of decoding JS errors has its own challenges—for example, the presence of minified Javascript that obscures your code and makes errors more difficult to interpret and diagnose. New Relic Browser gives you the ability to upload sourcemaps to decode minified JS errors and to convert them into understandable stack traces.
Learn more about using Browser Sourcemaps to “unminify” your site’s Javascript errors.

Ready to learn more?
Looking for more Browser best practices and tips? Check out the the Browser Level Up category pages in the New Relic Explorers Hub, and discover a wealth of community-generated resources on these and related topics. When you’re ready, test your Browser knowledge by taking our Browser Best Practices Quiz, and earn your proficiency badge!
本ブログに掲載されている見解は著者に所属するものであり、必ずしも New Relic 株式会社の公式見解であるわけではありません。また、本ブログには、外部サイトにアクセスするリンクが含まれる場合があります。それらリンク先の内容について、New Relic がいかなる保証も提供することはありません。


