If you're on call today, you're probably juggling more alerts than you can realistically triage. In security alone, organizations take an average of 241 days to identify and contain a data breach, according to IBM’s 2025 Cost of a Data Breach Report. That kind of lag isn't just a security problem—it’s a symptom of how hard it is to make sense of noisy, fragmented telemetry across modern systems.
Artificial intelligence for IT operations (AIOps) applies machine learning directly to your metrics, logs, traces, and events so you can cut through that noise, detect issues earlier, and resolve incidents faster to reduce downtime. Instead of adding yet another dashboard, it helps you get a real signal out of the tools and data you already have, including your application performance monitoring tools.
Key takeaways
- AIOps applies machine learning to full-stack telemetry—metrics, logs, traces, and events—to surface real signals and detect issues earlier.
- By correlating alerts into a single, enriched incident, AIOps reduces manual triage and speeds up root cause analysis for developers on call.
- When built on unified observability data (like New Relic Applied Intelligence), AIOps enables predictive insights and safe automation without adding tool sprawl.
Why is AIOps in demand?
AIOps is gaining traction because systems are scaling faster than most developers and IT teams are able to manually manage. Microservices, distributed architectures, and frequent deployments all increase complexity, but your team size and on-call bandwidth may not grow at the same rate.
Modern software development optimizes for rapid releases, which puts continuous pressure on reliability and on the people responsible for it—SREs, DevOps engineers, and on-call developers. You’re expected to meet strict SLAs and SLOs while dealing with:
- High volumes of telemetry from infrastructure, services, and user experience
- Alert storms from loosely tuned application performance monitoring tools
- Incidents that span multiple systems, teams, and vendors
Manually investigating every anomaly or alert doesn’t scale. You lose time pivoting between tools, building ad hoc queries, and reconstructing timelines from partial data, which directly impacts MTTR, customer experience, and sometimes revenue.
AIOps addresses this by applying machine learning to the full stream of observability data, automatically surfacing anomalies, correlations, and likely root causes. It doesn’t replace your tools or your judgment—it reduces the work required to get from “something is wrong” to “this is the probable cause and best next step.”
What is AIOps and why does it matter for developers?
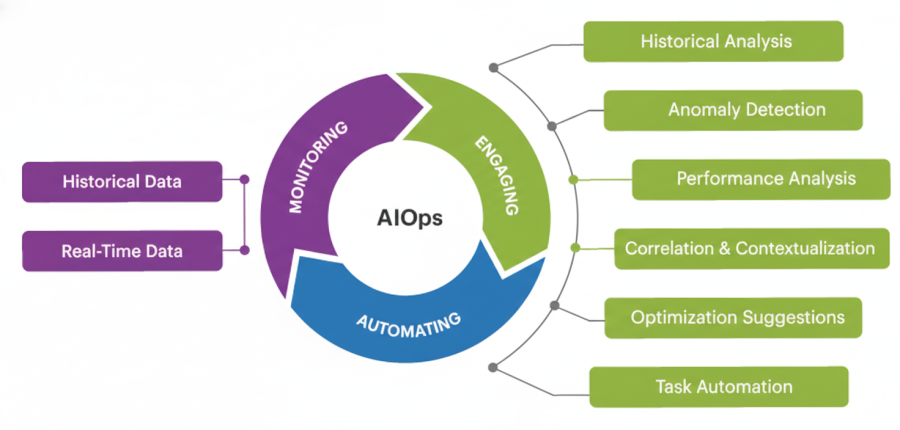
Artificial intelligence for IT operations (AIOps) is the practice of applying machine learning and statistical techniques to your operational telemetry—metrics, events, logs, traces, and alerts—to detect, understand, and resolve issues more efficiently.

Concretely, an AIOps platform ingests data from your application performance monitoring tools, infrastructure monitoring, log pipelines, incident management systems, and more. It then uses algorithms to:
- Learn normal behavior and detect anomalies in real time
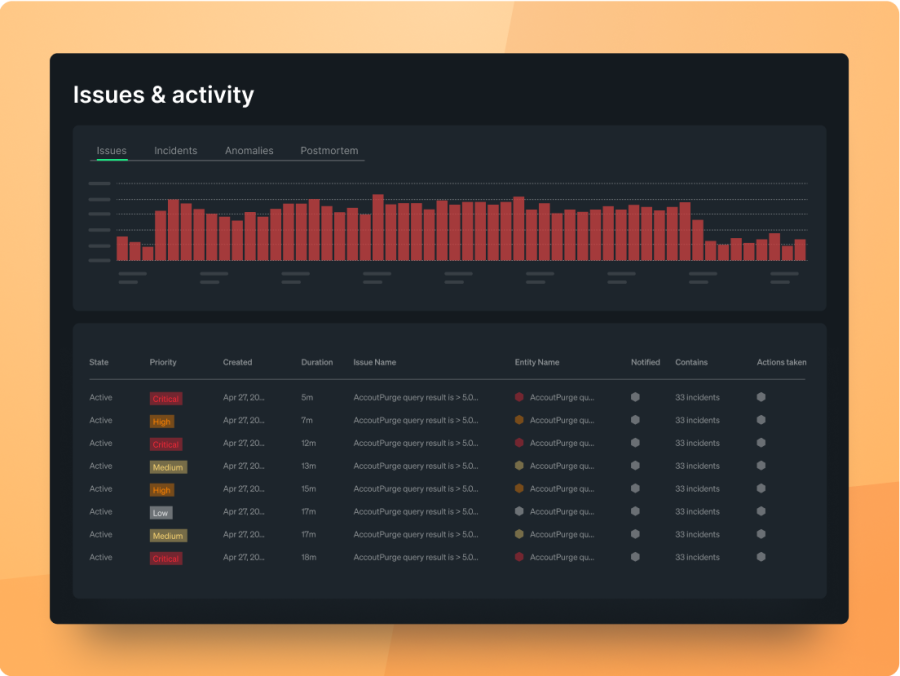
- Correlate related alerts and events into a single, enriched incident
- Highlight likely root causes and impacted components
- Trigger or recommend remediation actions based on runbooks and patterns
But what exactly does that look like? How does it differ from traditional developer systems and setups? Essentially, AIOps streamlines your workflows with targeted optimization:
- Dynamic baselines vs. static thresholds: Traditional monitoring often fires when a metric crosses a fixed threshold (e.g., 80% CPU). AIOps builds baselines per service, time of day, or traffic pattern, flagging behavior that’s unusual for that specific context.
- Correlated incidents vs. isolated alerts: Without AIOps, you might see separate alerts for latency spikes, error rates, and pod restarts. AIOps can group those into a single incident, showing they share the same underlying cause.
- Context-rich triage vs. manual pivots: Instead of teams jumping between logs, traces, dashboards, and tickets, AIOps assembles that context automatically and presents it in digital workspaces—like Slack, PagerDuty, Jira, or your observability UI.
In short, AIOps matters because it moves a lot of low-level, repetitive triage work into the platform for greater operational efficiency, so you can spend more time fixing issues and building features.
Top AIOps use cases for modern IT operations
AIOps isn’t one feature—it’s a set of capabilities you can apply across your incident lifecycle. Here are five core developer-focused use cases and how they show up in real systems.
1. Automated incident detection and root cause analysis
Automated detection and analysis helps you find incidents before customers do and narrow them down quickly once they happen. Instead of waiting for a static alert to fire, AIOps solutions continuously learn what “normal” looks like across your services and flag deviations.
Imagine your microservices architecture generates 10,000+ alerts per day across multiple environments. During a real incident, you care about the handful that actually explain why a checkout flow is failing. An AIOps platform can:
- Detect unusual spikes in error rates, latency, or resource allocation without you predefining every condition
- Map those anomalies to specific services, dependencies, deployments, or infrastructure changes
- Assemble an incident view that includes the most relevant metrics, logs, and traces up front
The practical outcome is shorter time from “page received” to “we know where to look,” which typically shrinks MTTR and reduces the number of people you have to pull into an incident call.
2. Predictive analytics for outage prevention
Predictive analytics uses trends in your telemetry to flag issues before they turn into incidents. Instead of only reacting to hard failures, you get early warnings when behavior starts drifting toward trouble.
For example, an AIOps system can watch saturation trends for a critical database, correlate them with traffic patterns, and forecast when you’re likely to hit performance limits. It can do the same for:
- Slowly increasing error rates after a rollout that suggest a memory leak
- Rising queue depths that point to downstream slowness
- Gradual performance regressions visible in traces but not yet impacting SLAs
With that information, you can schedule scale-ups, roll back specific deployments, or optimize queries before customers notice anything is wrong.
3. Intelligent alert correlation and noise reduction
Alert fatigue kills your ability to respond effectively. Intelligent correlation and noise reduction aim to make every page you receive meaningful and well-scoped.
When your stack and application performance monitoring tools generate tens of thousands of alerts per day, AIOps tools can:
- Group alerts that share common attributes (service, host, region, deployment, error code) into a single incident
- Suppress low-value or flapping alerts that don’t change your response
- Prioritize incidents based on blast radius—impacted users, key transactions, or critical services
In practice, teams often move from large, noisy alert streams to a smaller set of actionable, enriched incidents. That means fewer false positives, fewer overnight pages, and a higher chance that when something does wake you up, it genuinely matters.
4. Capacity planning and resource optimization
Capacity planning is no longer a quarterly spreadsheet exercise. With dynamic, cloud-native infrastructure, you need continuous visibility into how your services use resources—and what that means for cost and reliability.
AIOps can analyze historical and real-time metrics from your infrastructure and application performance monitoring tools to:
- Spot over-provisioned services and recommend rightsizing based on actual usage
- Identify hotspots where CPU, memory, I/O, or connection pools regularly run close to limits
- Forecast resource needs for peak events like product launches or seasonal traffic
This helps you avoid both extremes: paying for idle capacity you don’t need or hitting performance ceilings because you didn’t see the trend in time. It also gives you data to back up decisions about scaling policies, instance types, and regional deployments.
5. Automated remediation and self-healing systems
Automated remediation takes AIOps from “better detection” to “faster resolution.” Once you trust how incidents are detected and enriched, you can safely automate well-understood responses.
Common examples include:
- Restarting unhealthy pods or instances when specific health checks fail repeatedly
- Rolling back a deployment when error rates spike for a new version within a defined window
- Scaling a service based on predictive load rather than lagging CPU utilization
- Triggering feature flags or circuit breakers when downstream dependencies are degraded
You don’t have to jump straight to full “self-healing.” A practical path is to start with automation that suggests actions, then gradually promote the most reliable ones to run automatically under controlled conditions for optimized incident resolution.
How AIOps enhances developer workflows and productivity
AIOps isn’t just about ops metrics—it changes how you work day to day as a developer, especially if you take turns on call.
First, it reduces context switching. Instead of bouncing between multiple tools to piece together an incident, you get correlated context in the tools you already use, with relevant charts, logs, traces, related changes, and suggested causes.
Second, it cuts down on time-consuming false positives. With AI-powered noise reduction and smarter thresholds, you see fewer “ack and ignore” alerts and more incidents that actually need your attention. That means fewer unnecessary interruptions during focus time so you can get through workloads more efficiently.
Third, it accelerates learning from incidents. When the platform automatically captures timelines, impacted entities, and contributing factors with machine-learning algorithms, post-incident reviews become less about reconstructing what happened and more about deciding how to harden the system. Over time, that leads to more favorable business outcomes, like:
- Lower MTTR for recurring failure modes
- Higher deployment frequency because you’re more confident in detection and rollback
- Better adherence to SLOs and error budgets with less manual tracking
The net effect is more time building and less time firefighting, without losing visibility or control.
Key challenges and considerations when implementing AIOps use cases
Implementing AIOps isn’t a magic switch. To get useful results, you need to be honest about where your telemetry and processes are today.
Key challenges you’re likely to encounter include:
- Data quality and coverage: If critical services aren’t instrumented or key logs are missing, any AI layer will have blind spots. Make sure your core applications and infrastructure emit metrics, traces, and logs with consistent naming and tagging.
- Fragmented tools: When alerts live in one system, logs in another, and traces in a third, correlation is harder. AIOps functions best when you can centralize or virtually unify telemetry from your application performance monitoring tools and infrastructure monitoring.
- Model warm-up and tuning: Anomaly detection and baselining improve as the system sees more data. You’ll need to allow some time for learning, and be prepared to tune policies and thresholds based on early results.
- Integration complexity: Connecting incident management tools, chat platforms, and CI/CD systems takes time. Plan a phased rollout, starting with the systems involved in your most critical services.
- Change management: Your team needs to trust the insights and automations. Start by surfacing recommendations and correlations alongside your existing alerts, then gradually rely on them as confidence grows.
To evaluate your AIOps readiness, ask yourself:
- Do you already have basic observability in place (metrics, logs, traces for key services)?
- Are you experiencing alert fatigue or slow, manual incident investigations?
- Can you integrate your current tooling via APIs or webhooks?
If the answers are mostly yes, you’re in a good position to run a focused AIOps pilot on a subset of services and use cases, then expand from there.
Why New Relic Applied Intelligence is unique
New Relic Applied Intelligence adds an AIOps layer on top of the telemetry you already collect. The focus is to support smarter decision-making with correlated, explainable insights rather than opaque “AI says so” outputs.
Applied Intelligence can ingest, correlate, and alert using data from New Relic and external sources such as PagerDuty, Slack, Jira, ServiceNow, and more. These actionable insights help you break down silos and see how potential issues propagate across services, infrastructure, and teams.

Some technical capabilities especially useful to development and SRE teams include:
- Unified telemetry and incident context: Metrics, events, logs, traces, and alerts from across your stack are analyzed together. Incidents can be enriched with deployment events, error logs, trace exemplars, and related entities.
- Out-of-the-box and tunable correlations: New Relic provides automatic correlation rules based on topology, tags, and timing, and you can extend or refine them with your own logic—by specifying which attributes to compare and how aggressively to group alerts.
- Transparent correlation logic: For each correlated incident, you can see why alerts were grouped together (shared entity, tag, time window, or other factors). That transparency makes it easier to trust and adjust the system.
- API-first integrations: You can integrate Applied Intelligence into your existing workflows using APIs and webhooks, so incident intelligence shows up where you already work rather than requiring a new standalone tool.
The result is an AIOps capability that works alongside your current monitoring and incident management setup, instead of forcing you to replace it.
Maximizing value from AIOps use cases in development teams
To get the most out of AIOps, treat it as an incremental improvement to how you operate, not a one-time project or a replacement for your team’s expertise.
A practical rollout plan for development teams might look like this:
- Start with noise reduction: Enable alert correlation and suppression on a few noisy services. Measure changes in alert volume and the number of incidents per week.
- Add enriched incident context: Integrate your incident management and chat tools so responders see metrics, logs, and traces directly from incident notifications.
- Introduce predictive and anomaly detection: Turn on anomaly detection for key user flows and critical dependencies, and track how often these detections catch issues before customers do.
- Layer in safe automation: Automate low-risk, well-understood runbook steps and monitor their impact on MTTR and engineer time spent on repetitive tasks.
Across these phases, use developer-relevant metrics to gauge success, such as:
- Reduction in total alert volume and duplicate alerts
- Improvement in MTTR for priority incidents
- Fewer incidents impacting SLAs or SLOs
- More time spent on feature work vs. incident response
If you want to see how these AIOps capabilities behave with your own telemetry and incident workflows, you can request a guided demo of New Relic Applied Intelligence. That’s often the fastest way to understand where AIOps can reduce alert noise, surface likely root causes, and help your team handle incidents with more confidence.
FAQs about AIOps
Is AIOps only useful for large systems?
No. AIOps is useful whenever your systems are complex enough that manual triage is slowing you down or creating alert fatigue. Large, distributed architectures benefit the most, but even smaller teams with a few critical services can gain value from better correlation, anomaly detection, and enriched incidents. If you’re already using observability and incident management tools, AIOps can usually add value on top.
How long does it take to see value from AIOps?
It depends on your observability maturity and scope, but many teams see early benefits—especially around alert noise reduction and incident enrichment—within a few weeks. Anomaly detection and baselining typically improve over time as the system observes more data. The key is to start with a focused use case and a small set of services, measure the impact, then expand gradually.
Does AIOps require historical data?
Historical data helps AIOps learn baselines and seasonality faster, but you don’t need years of history to start. Most platforms can begin with live data and build useful models over days or weeks. That said, the more complete and consistent your telemetry is—metrics, logs, traces, and alerts—the better the models and correlations will perform.
本ブログに掲載されている見解は著者に所属するものであり、必ずしも New Relic 株式会社の公式見解であるわけではありません。また、本ブログには、外部サイトにアクセスするリンクが含まれる場合があります。それらリンク先の内容について、New Relic がいかなる保証も提供することはありません。


