Today, your digital business is defined by your customer experience. And when outages create an unsatisfactory experience for your customers, the fallout can be costly: Analyst firm Gartner estimated that the average cost of an outage is $5,600 per minute. That’s over $50,000 per every 10 minutes your site is unavailable.
Distributed tracing is an essential component to resolving—and preventing—these types of outages. Teams use distributed tracing to track transaction requests as the requests travel through interconnected back-end services, which are frequently owned and managed by different teams. And distributed tracing on the New Relic One platform helps customers like Dealer.com avoid downtime by givingDevOps teams greater visibility into application performance issues—making it easier to find and fix latency, errors, and anomalies within their complex, distributed systems.
"New Relic's distributed tracing is valuable to us because it connects transactions through our distributed systems, from web browser and network to our backend services, which helps us isolate issues faster, regardless of where they occur."—Dan Boisvert, Lead Site Reliability Engineer at Dealer.com, a Cox Automotive brand
We know that it’s more important than ever that you create and maintain the best possible digital experiences for your customers. That’s why New Relic has enhanced its distributed tracing capabilities with support for end-user traces in New Relic Browser. Now, it’s easier than ever to monitor the entire lifespan of a trace.
Every customer with a New Relic APM subscription and a Browser Pro agent configured for single-page application (SPA) monitoring will get this new capability at no extra charge.
Bringing distributed tracing into Browser
If you’re not already familiar with New Relic distributed tracing, check out this blog post on getting started. Essentially, we describe distributed tracing as a way to instrument, propagate context, record, and visualize requests through complex, distributed systems.
Alongside distributed tracing, the New Relic Trace API gives teams the ability to ingest trace data from open source instrumentation tools like Zipkin, Istio, OpenTelemetry, and OpenCensus. Using the trace data collected from such tools, New Relic is able to tell a complete story about the lifespan of a transaction, offering end-to-end visibility and connectivity, from the time spent in the web browser and network, to the response from back-end services.
Until now, New Relic distributed tracing toolset didn’t always give customers the full context of how issues in the back end affected their customers’ experience. Consider this example: A back-end developer in Portland receives an alert that a service she owns is experiencing an outage. She isolates the issue via New Relic distributed tracing and takes the necessary resolution actions, but she has no visibility into how the issue impacted customers or which teams she should notify to coordinate a response.
Meanwhile, at that very moment, the developer’s colleagues on the front-end team in Barcelona see the customer impacts that the developer couldn’t see: slow response times for particular AJAX requests, a sudden increase in overall page load times, and eventually a spike in support calls from frustrated customers. While the impacts from the outage were all too clear, this team could have benefitted from knowing what caused the outage and what had been done to resolve it. Without this end-to-end visibility into the full application lifecycle, and with the added complexity of a system developed by global teams, none of the teams involved in the process were as fast or as efficient as they could have been.
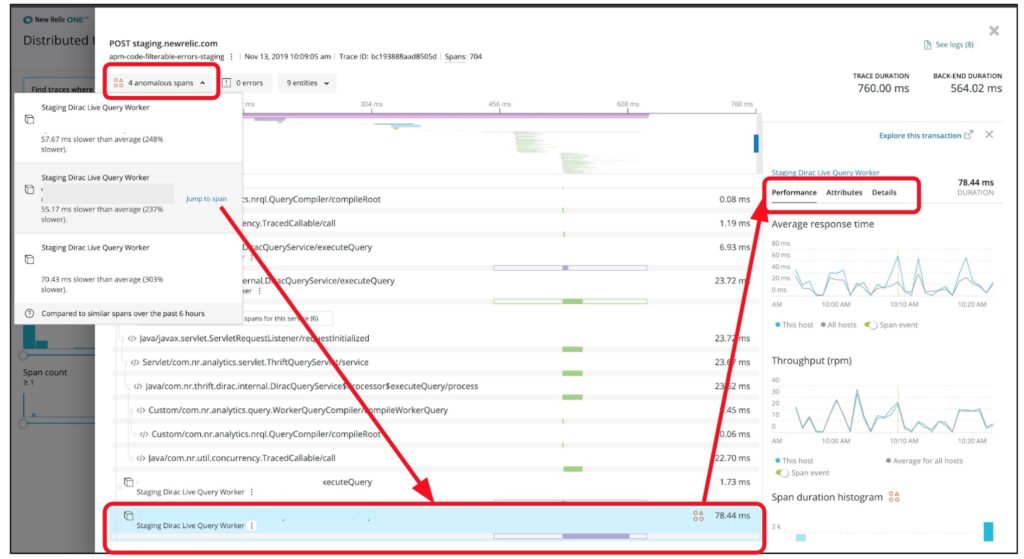
With the addition of distributed tracing in New Relic, front-end engineers responsible for performance of their sites can easily discover which back-end services are impacting their customer experiences. Similarly, when a back-end service is experiencing an issue, back-end engineers now have a clear understanding of how that issue is affecting customers, as both front-end and back-end developers can now see traces that originate with the browser. And when teams apply distributed tracing anomaly detection, New Relic Applied Intelligence will automatically highlight unusually slow spans within a trace, making it easier for all teams to find and focus on these anomalous sources of latency.
How to incorporate end-user traces in New Relic Browser
To use distributed tracing in New Relic Browser, you’ll need to meet the following requirements:
- An APM Pro subscription
- Distributed tracing enabled
- A Browser Pro subscription with a Browser agent enabled for single-page application (SPA) monitoring
- Account level access to see data for the applications (Browser) and services (APM) you expect to see in a full trace
If you satisfy those requirements:
- Go to rpm.newrelic.com/browser > (select an app) > Application settings.
- Toggle Distributed tracing to on.
- Redeploy the Browser agent. If you use an APM agent to inject Browser code, restart the APM agent.
To access end-user originated traces, use distributed tracing in New Relic One, or use the AJAX page in New Relic Browser. The new Browser span event provides information about the browser portion of a trace, such as the request URL, which can help teams determine how their service issue is affecting front-end requests. Front-end developers can also view traces for specific AJAX requests, even for cross-origin domains, to improve the performance of their web applications.
You can query Browser-based trace spans as span data, using any Browser-specific attribute (for example, by setting entity.name to your Browser app name).
Troubleshooting with distributed tracing in New Relic Browser
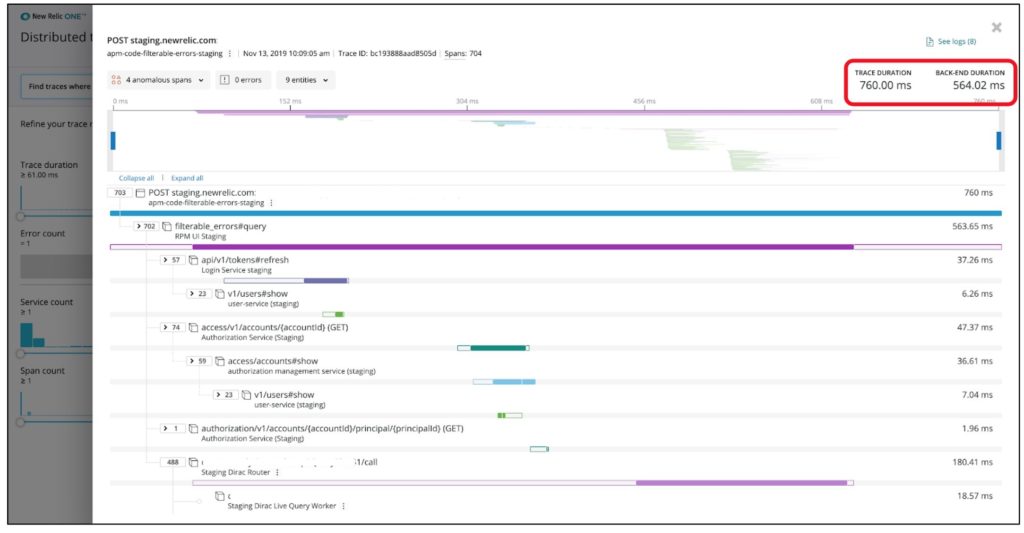
When troubleshooting a particular transaction that has an unusually slow response time, for example, start from New Relic Browser. Select an Ajax request and follow the link to distributed traces in New Relic One.
From the distributed tracing UI, examine traces to determine if a back-end service is the source of the transaction latency.
Next, dive deeper to investigate all entities involved in the trace, and jump directly to anomalous spans that are potential sources of the latency.
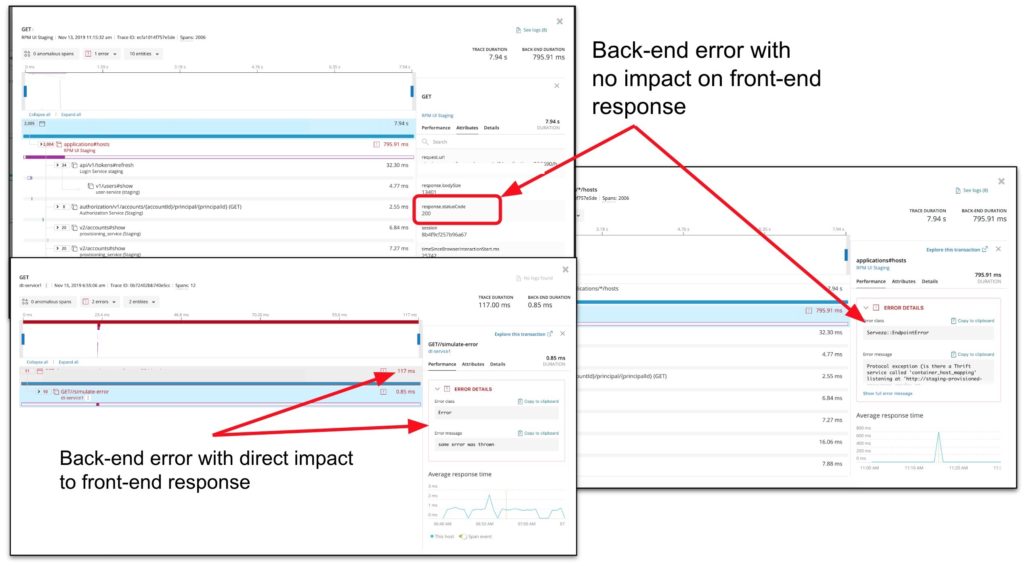
Finally, differentiate between errors in back-end services that did not affect front-end request response times and errors that had a direct impact on response times.
Be proactive with end-to-end distributed tracing
DevOps teams can find and fix issues faster when they’re proactive with end-to-end distributed tracing. Regardless of where an issue originates (whether it’s an outage, latency, or customer complaint), teams using New Relic can leverage end-to-end distributed tracing to isolate an issue and determine if it’s coming from the web browser or network, or from a back-end service, and then communicate with the team responsible for the fix.
As an open platform, New Relic One gives you the tools you need to ingest open source tracing instrumentation from popular tools like Zipkin, Istio, and OpenTelemetry. As a connected platform, New Relic One, connects servers, software, and end-user experience, helping you find and fix incidents faster, so you can get back to working on the things that matter.
Try distributed tracing in New Relic One today.
Die in diesem Blog geäußerten Ansichten sind die des Autors und spiegeln nicht unbedingt die Ansichten von New Relic wider. Alle vom Autor angebotenen Lösungen sind umgebungsspezifisch und nicht Teil der kommerziellen Lösungen oder des Supports von New Relic. Bitte besuchen Sie uns exklusiv im Explorers Hub (discuss.newrelic.com) für Fragen und Unterstützung zu diesem Blogbeitrag. Dieser Blog kann Links zu Inhalten auf Websites Dritter enthalten. Durch die Bereitstellung solcher Links übernimmt, garantiert, genehmigt oder billigt New Relic die auf diesen Websites verfügbaren Informationen, Ansichten oder Produkte nicht.


