Quickstart
Comprehensive monitoring quickstart for WordPress
WordPress is a popular open-source content management system (CMS) used for creating websites, blogs, and web applications. It provides a user-friendly interface and a wide range of customizable themes and plugins, allowing users to build and manage their online content without extensive coding knowledge.
New Relic WordPress Full Stack quickstart enables performance monitoring of your WordPress application through agents installation and New Relic Flex configuration.
Why monitor WordPress?
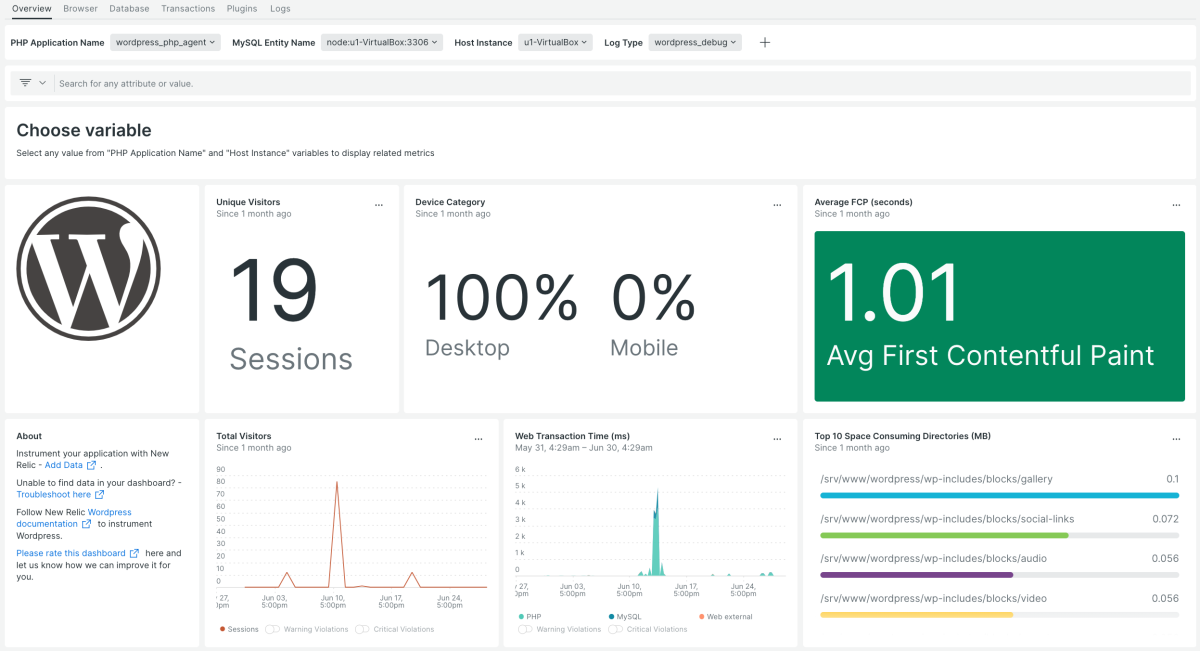
Websites across various domains extensively utilize WordPress applications. Despite their versatility, these websites can experience slowdowns caused by factors such as slow-loading plugins, database connection problems, or other variables. Our WordPress Full-Stack quickstart offers step-by-step documentation for instrumenting the quickstart and provides a pre-built dashboard to monitor crucial performance metrics, database metrics, and error messages generated on a specific URL. These indicators assist you and your team in identifying and addressing concerns, ultimately enhancing your website's performance.
What’s included in this quickstart?
New Relic WordPress Full Stack monitoring agent capture the following metrics:
- Easily identify plugins that consume the most time and resources
- User usage statistics i.e., user device type and unique visitors
- Database metrics like connections per second and more
- Browser metrics like page view comparison, time to first byte (TTFB) and more
- Transactions and related error messages
- WordPress debug logs are also captured
Need help? Visit our Support Center or check out our community forum, the Explorers Hub.

