現在、このページは英語版のみです。
 / 
SonarQube

SonarQube

Identify and optimize SonarQube performance with New Relic SonarQube monitoring.

What's included?

dashboards
1
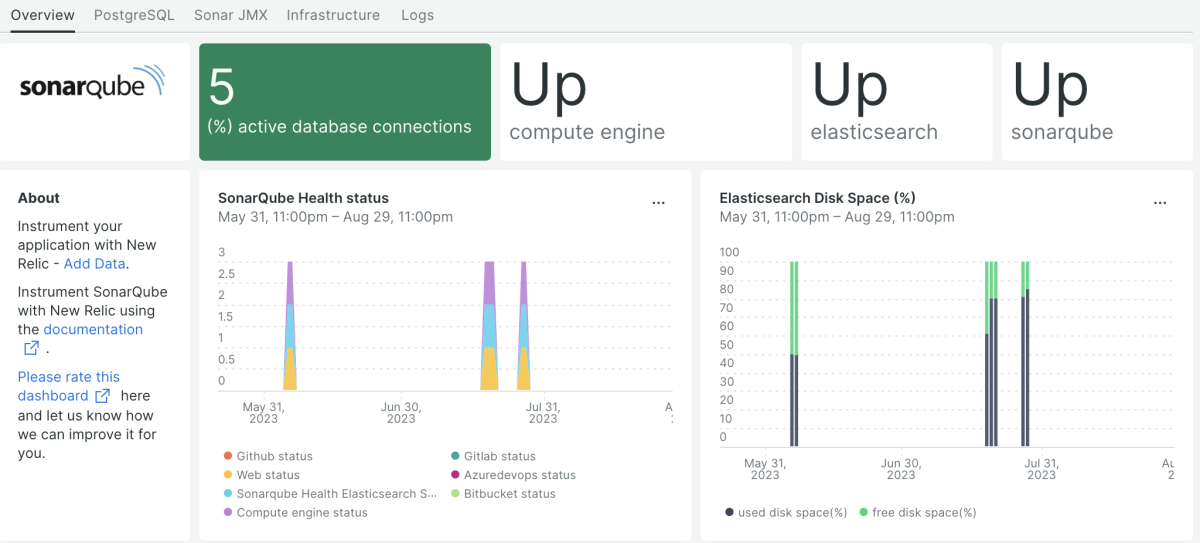
SonarQube quickstart contains 1 dashboard. These interactive visualizations let you easily explore your data, understand context, and resolve problems faster.
alerts
4
SonarQube observability quickstart contains 4 alerts. These alerts detect changes in key performance metrics. Integrate these alerts with your favorite tools (like Slack, PagerDuty, etc.) and New Relic will let you know when something needs your attention.
SonarQube Downtime
The alert is triggered when the SonarQube is down for at least 5 minutes.
Elasticsearch Up
This alert is triggered when Elasticsearch is down for at least 5 minutes.
Compute Engine Up
This alert is triggered when the compute engine is down for at least 5 minutes.
Percentage of Active Database Connections
This alert is triggered if the database connections usage exceeds 90% for 5 minutes.
documentation
1
SonarQube observability quickstart contains 1 documentation reference. This is how you'll get your data into New Relic.

Comprehensive monitoring quickstart for SonarQube

By integrating SonarQube with New Relic, you can get comprehensive information about the quality of your codebase and receive alerts about serious vulnerabilities. You can keep track of your code deployments as well as the complete CI/CD workflow by visualizing and gathering metrics and logs.

Why monitor SonarQube?

The open source platform SonarQube is utilized by development teams to ensure the quality of their source code. SonarQube was specifically designed to provide accessible code quality control to all users.

By leveraging New Relic, you can enhance your understanding of the health and performance of your SonarQube server, regardless of whether it is deployed on-premises or in a containerized environment. Additionally, New Relic enables you to assess the quality and stability of your code throughout the development process, offering valuable insights.

What’s included in this quickstart?

New Relic SonarQube monitoring quickstart provides quality out-of-the-box reporting:

  • Code duplication
  • Coding guidelines
  • Identify possible bugs due to code complexity
  • Design and architecture comments
  • Display and keep track of important code metrics
  • Gather SonarQube logs and review them to gain knowledge of its condition

How to use this quickstart

  • Sign Up for a free New Relic account or Log In to your existing account.
  • Click the install button.
  • Install the quickstart to get started or improve how you monitor your environment. They're filled with pre-built resources like dashboards, instrumentation, and alerts.
Authors
New Relic
Support
BUILT BY NEW RELIC
Need help? Visit our Support Center or check out our community forum, the Explorers Hub.
Related resources