Quickstart
Why monitor Kafka using OpenTelemetry?
Apache Kafka is a distributed streaming platform designed for building real-time data pipelines and streaming applications. It handles high-throughput, fault-tolerant message streaming across multiple brokers, topics, and partitions.
OpenTelemetry is an open source observability framework that provides IT teams with standardized protocols and tools for collecting and routing telemetry data. Organizations adopting OpenTelemetry gain the advantage of vendor neutrality by using flexible and open-source agents and collectors.
New Relic provides OpenTelemetry observability for Kafka, ingesting comprehensive metrics from brokers, topics, partitions, and consumer groups. This enables you to monitor cluster health, track message throughput, analyze consumer lag, and troubleshoot performance issues across your Kafka infrastructure.
This quickstart gives you visibility into your Kafka clusters and streaming workloads in minutes, whether your clusters are self-hosted or running on Kubernetes with Strimzi.
Kafka (OpenTelemetry) quickstart highlights
Included in this quickstart you will find:
- Instructions to install our Kafka monitoring with OpenTelemetry.
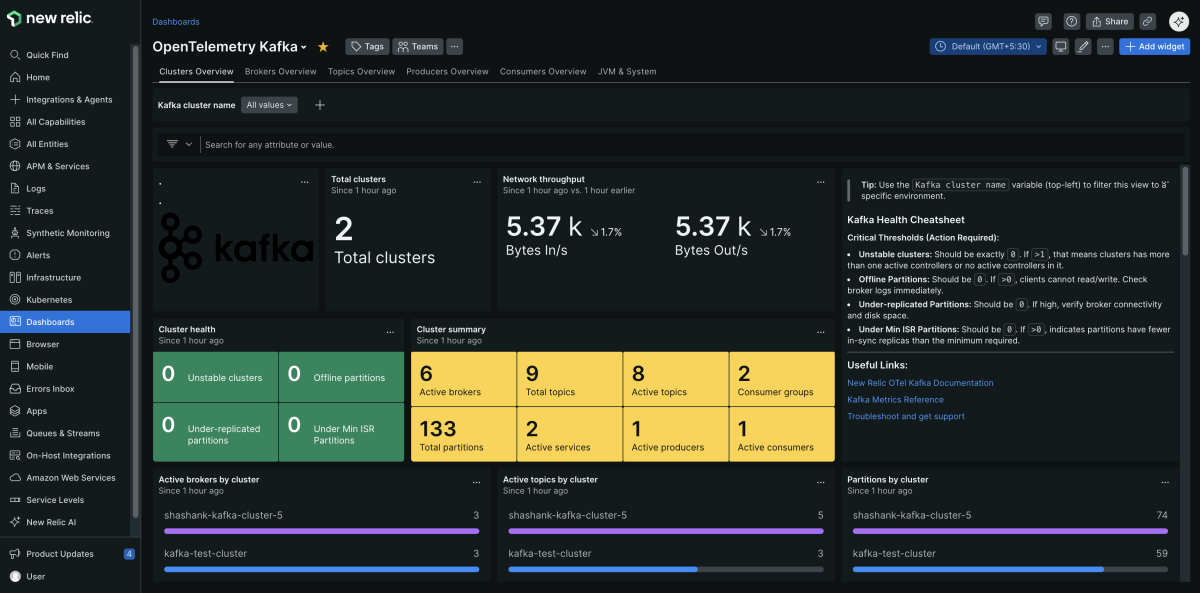
- Comprehensive dashboards tracking:
- Cluster health and broker status
- Topic and partition metrics
- Consumer group performance and lag
- Message throughput (bytes in/out per second)
- Network I/O and request rates
- Partition replication status
- Guided alert creation recommendations for:
- Kafka broker health monitoring
- Kafka cluster performance
- Kafka topic and consumer lag alerts
New Relic + Kafka + OpenTelemetry = Complete observability
Monitor your distributed streaming platform with open-source instrumentation that provides vendor neutrality while delivering comprehensive insights into your Kafka infrastructure. Track broker performance, partition health, consumer lag, and message throughput using standardized OpenTelemetry collectors paired with New Relic's powerful visualization and alerting capabilities.
Need help? Visit our Support Center or check out our community forum, the Explorers Hub.


