今すぐNew Relicを開始 さらなる革新をお望みですか?10月から夢の実現を始めましょう。
今すぐ申し込む
現在、このページは英語版のみです。
 / 
Flutter Android

Flutter Android

Identify and optimize Flutter Android app performance with New Relic Flutter Android monitoring.

What's included?

dashboards
1
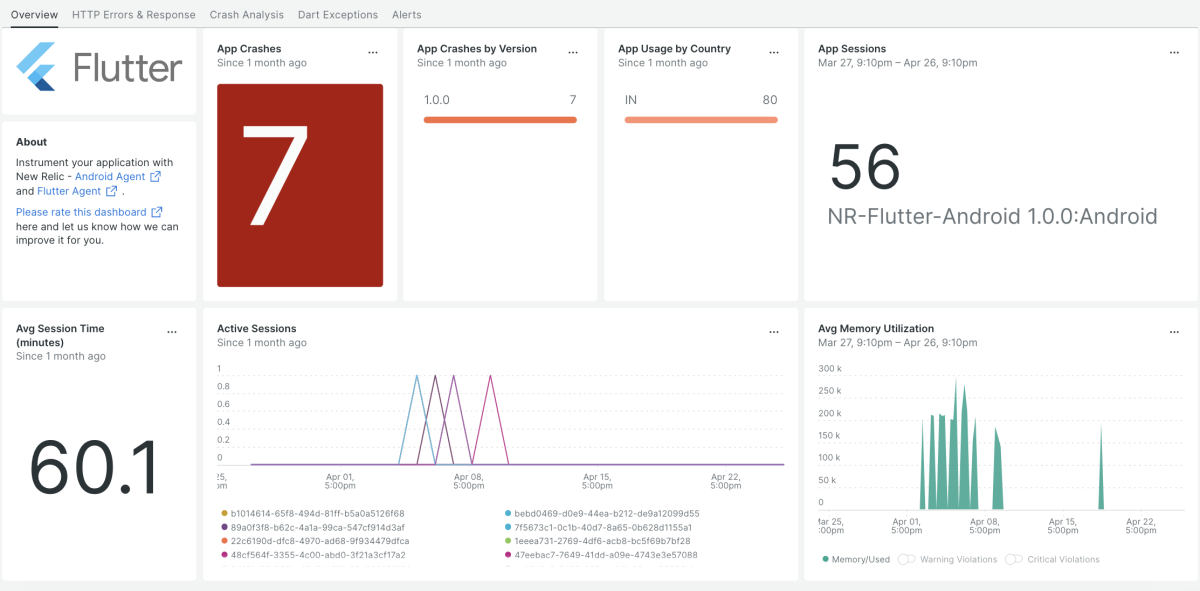
Flutter Android quickstart contains 1 dashboard. These interactive visualizations let you easily explore your data, understand context, and resolve problems faster.
alerts
4
Flutter Android observability quickstart contains 4 alerts. These alerts detect changes in key performance metrics. Integrate these alerts with your favorite tools (like Slack, PagerDuty, etc.) and New Relic will let you know when something needs your attention.
Error Rate
This alert is triggered when the error rate exceeds 4% for 5 minutes.
HTTP Response Time
This alert is triggered when the HTTP response time exceeds 5 seconds for 5 minutes.
App Crash Rate
This alert is triggered when the application crash rate exceeds 20% for 5 minutes.
Users Affected Rate
This alert is triggered when the users affected rate exceeds 5% for 5 minutes.
documentation
1
Flutter Android observability quickstart contains 1 documentation reference. This is how you'll get your data into New Relic.

Comprehensive monitoring quickstart for Flutter Android

Monitor your Flutter applications and analyze performance bottlenecks while operating in a live development environment. You can use this dashboard to visualize your web user experience with your application rendition.

Why monitor Flutter Android?

Monitoring app performance allows you to avoid crashes, bugs, or user complaints by taking a preventative approach rather than waiting until an issue arises. With New Relic Android and Flutter agents, you can track important metrics such as network failures, HTTP response times, slow launches, and custom traces.

You can optimize the process once you have a comprehensive picture of all releases by prioritizing active issues and marking errors as corrected. Identify the release in which the problem first appeared, merge duplicates, and assess whether the issue may worsen. Send deploy emails instantly with commit information, and suggest an owner for each application error.

What’s included in this quickstart?

New Relic Android and Flutter monitoring agents capture the following metrics:

  • Get alerted when critical issues affect your Flutter application
  • Dashboards (error rate, app launches, app installations, app crashes and more)
  • Monitor Flutter Dart exceptions and errors
  • Monitor HTTP responses & errors, and mobile events

How to use this quickstart

  • Sign Up for a free New Relic account or Log In to your existing account.
  • Click the install button.
  • Install the quickstart to get started or improve how you monitor your environment. They're filled with pre-built resources like dashboards, instrumentation, and alerts.
Authors
New Relic
Support
BUILT BY NEW RELIC
Need help? Visit our Support Center or check out our community forum, the Explorers Hub.