Get context into your containerized Docker applications
New Relic’s Docker monitoring integration allows you to gain instant visibility into changes in containerized applications’ key performance indicators. Automatically collect metrics for Docker containers running on hosts to visualize and pinpoint performance anomalies. Whether it's a sudden spike in resource usage or a degraded container, you can rely on New Relic’s Docker monitoring dashboard to guide you to the source of the issue.


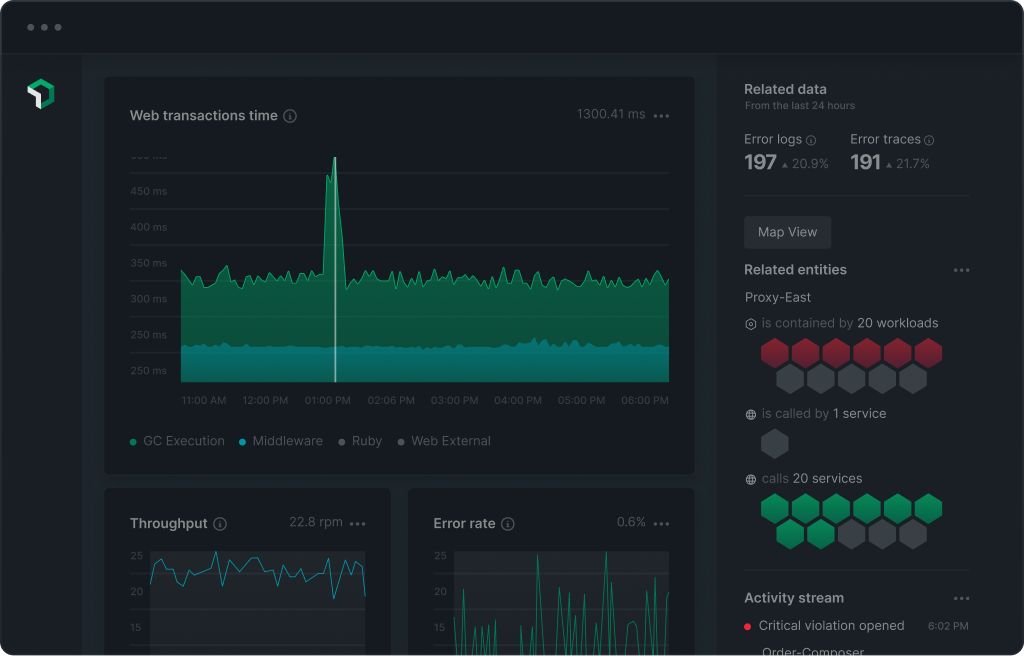
Interactive dashboards for enhanced performance monitoring
- Instantly visualize your Docker performance KPIs
- Get alerts on spikes in error rates and query response times
- Customize your Dockerl metric visualizations using SQL
- Get context into the root cause of your container issues


