New Relic Now Start training on Intelligent Observability February 25th.
Save your seat.
現在、このページは英語版のみです。
 / 
Azure IoT Hub

Azure IoT Hub

Monitoring Azure IoT Hub is critical to tracking the performance through key metrics. Install the New Relic Azure IoT Hub monitoring quickstart to get a pre-built dashboard tailored to monitor your Azure IoT Hub service.

What's included?

dashboards
1
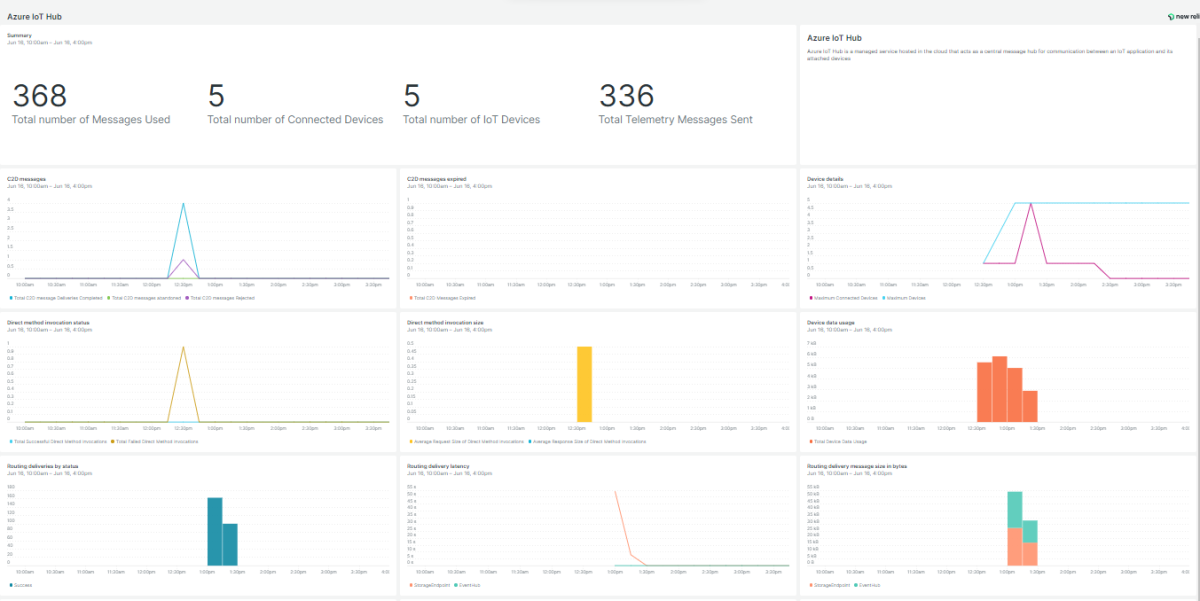
Azure IoT Hub quickstart contains 1 dashboard. These interactive visualizations let you easily explore your data, understand context, and resolve problems faster.
documentation
1
Azure IoT Hub observability quickstart contains 1 documentation reference. This is how you'll get your data into New Relic.
alerts
0
This quickstart doesn't include any alerts. Do you think it should?
You can edit this quickstart to add helpful components. View the repository and open a pull request.
View repo View repo

What is Azure IoT Hub?

Azure IoT Hub is a managed service hosted in the cloud that acts as a central message hub for communication between an IoT application and its attached devices.

New Relic Azure IoT Hub quickstart features

A standard dashboard that tracks key indicators like jobs completed, jobs failed, D2C endpoints latency and more. It runs custom queries and visualizes the data immediately.

Why monitor Azure IoT Hub with New Relic?

New Relic Azure Iothub monitoring quickstart empowers you to track the performance of Azure IoT Hub via different metrics including jobs completed, jobs failed, D2C endpoints latency and more.

Our integration features a standard dashboard that provides interactive visualizations to explore your data, understand context and get valuable insights.

Start ingesting your Azure data today and get immediate access to our visualization dashboards so you can optimize your Azure service.

How to use this quickstart

  • Sign Up for a free New Relic account or Log In to your existing account.
  • Click the install button.
  • Install the quickstart to get started or improve how you monitor your environment. They're filled with pre-built resources like dashboards, instrumentation, and alerts.