Vic Soares, a Director of Product Management at New Relic, contributed to this post. A version of this post previously ran on The New Stack.
Distributed tracing is an essential tool for developers working with highly-distributed microservices applications, allowing them to track event interactions that traverse multiple microservices. But not all tracing tools have followed the same methods for passing contextual information, via HTTP headers, as traces move from service to service. This lack of standardization has led to a jumble of mutually incompatible header formats, which can be a problem when development teams within an organization pick their own tracing tools.
W3C Trace Context is a standard that makes distributed tracing easier to implement, more reliable, and ultimately more valuable for developers working with modern, highly distributed applications. The standard greatly simplifies use cases where developers instrument services using tools from different distributed tracing solutions. Now all tracers and agents that conform to the W3C Trace Context standard can participate in a trace. Trace data can be propagated from the root service all the way to the terminal service.
For nearly two years, New Relic has participated in the W3C Trace Context Working Group, helping to define the standard and shepherd it through the approval process. The W3C Trace Context specification will reach "recommendation” status on February 4, but we’re excited to announce that we’ve launched support for the standard in anticipation of it reaching full ratification.
The following New Relic APM agents now support:
- Java 5.1.0 and higher
- Python 5.5 and higher
- Go 3.1.0 and higher
- Node.js 6.4 and higher
- Ruby 6.9.0 and higher
- PHP 9.8 and higher
- .NET 8.27 and higher
(We’ve also added support to the New Relic open source Elixir agent, and we’ll soon be adding Trace Context support for other APM agents, as well as the New Relic Browser agent.)
To get started, just update your agents to the appropriate version. (We explain backwards compatibility below.)
Read on for more about what standard means for distributed tracing and observability within the New Relic platform.
The trouble with distributed tracing today
Every distributed tracing tool requires a way to “correlate” each step of a trace, in the correct order, along with other necessary information to identify and diagnose performance. This involves:
- Assigning a unique ID to the whole trace
- Assigning a unique ID to each step in the trace
- Encoding this contextual information as a set of HTTP headers
- Passing (or propagating) the headers and encoded context from one service to the next as the trace makes its way through an application environment.
To learn more, review our introduction to distributed tracing, and also learn how we’ve implemented our own tracing solution.
Previously, each distributed tracing tool employed custom headers and context formats; for example, Zipkin used the B3 format, and at New Relic we developed our own proprietary format. This wasn’t a problem when trace context headers mostly traveled between services monitored by a single tracing tool or when headers rarely propagated beyond a single organization’s network and middleware infrastructure.
And like we said, it’s not uncommon for many development teams today to use their own tracing tools, and find themselves left with mutually incompatible header formats. When a tracing tool receives trace context headers it doesn’t understand, it typically drops the headers and breaks the traces that relied upon them. Trace context headers are also more likely than ever before to traverse middleware boundaries including proxies, service meshes, and messaging systems along the way. Some of these devices will pass along proprietary headers intact, but many others will drop them, once again resulting in broken traces.
W3C Trace Context: breaking down barriers to observability
W3C Trace Context enables cross-vendor interoperation of traces, one of the four essential telemetry types. This aligns with New Relic’s open instrumentation initiative and the release of our APIs, Telemetry SDKs, and exporters to meet customer needs for interoperation between vendors and open source tools.
W3C Trace Context is a useful and important way to ensure that New Relic’s distributed tracing tool can traverse services instrumented with agents from other vendors without the risk of broken traces, as well as reliably traverse third-party components, including proxies and API gateways. At the same time, W3C Trace Context will confer the same advantages upon open source tracers, enabling our customers to incorporate tracing telemetry from any source, at any time, and to implement traces across highly distributed application environments. This makes Trace Context a critical, and very welcome, technology for the future of observability.
Functionally, W3C Trace Context defines a pair of standardized context HTTP headers that serve to propagate context correlation information between services:
- A
traceparentheader contains the data elements that every distributed tracing model requires to define and propagate context: a trace ID, a parent ID, and a sample flag. - A
tracestateheader holds vendor-specific, contextual data, typically in order to support additional functionality or optimizations associated with a particular tracing tool.
This common context propagation format enables trace propagation across other trace instrumentation that conforms to the standard. A standard trace header format also clears barriers for middleware vendors to support propagating trace headers, and for framework vendors to build in tracing instrumentation.
If you need or want to use tools other than New Relic agents to instrument your services, but still want to capture those traces in our platform, we expect most vendors and open source instrumentation tools will support W3C Trace Context. Many have already released compliant tracers, including OpenTelemetry, which is one of the most critical game changers for standardizing instrumentation needed for observability across the industry.
As the standard matures, we expect any tracers or instrumentation using other header formats to adopt W3C Trace Context, and for more tools and shims to become available to enable existing instrumentation to be converted to W3C Trace Context for participation in multi-vendor traces.
The end result is more flexibility and fewer barriers to observability.
How W3C Trace Context works in New Relic
There are two scenarios for how W3C Trace Context works on the New Relic platform:
- Scenario 1: Where some trace data is sent to New Relic
- Scenario 2: Where all trace data is sent to New Relic
Let’s take a look at both.
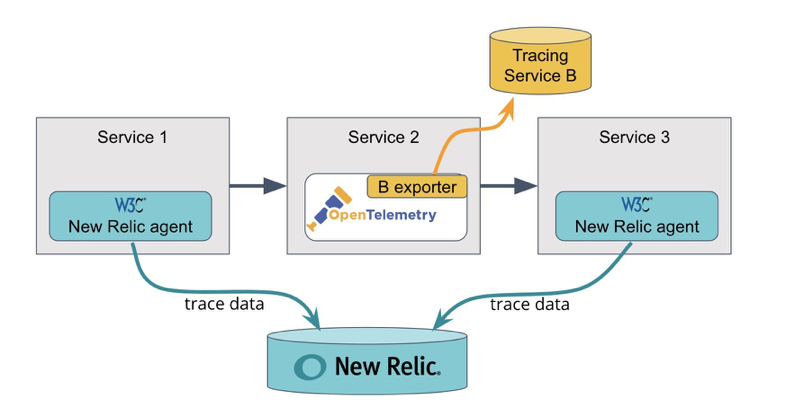
Scenario 1: Where some trace data is sent to New Relic
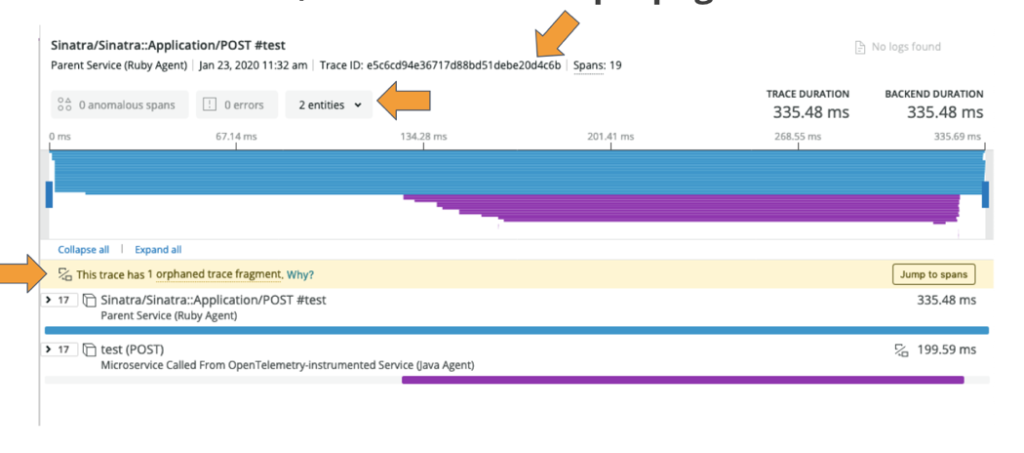
If all of your trace data is sent to New Relic, you’ll be able to observe a complete end-to-end trace in the distributed tracing UI. But, if some of the trace’s data is sent to another tracing service, or nowhere at all, you may need to dig around to find that data. With W3C Trace Context, however, you can use the trace ID to find other data associated with that trace.

For example, in such a scenario as described above, you’ll likely have a trace with missing spans. The New Relic distributed tracing UI will show that the trace has a gap, but using the surrounding spans, you can still calculate the total time for the trace, or perform other troubleshooting.

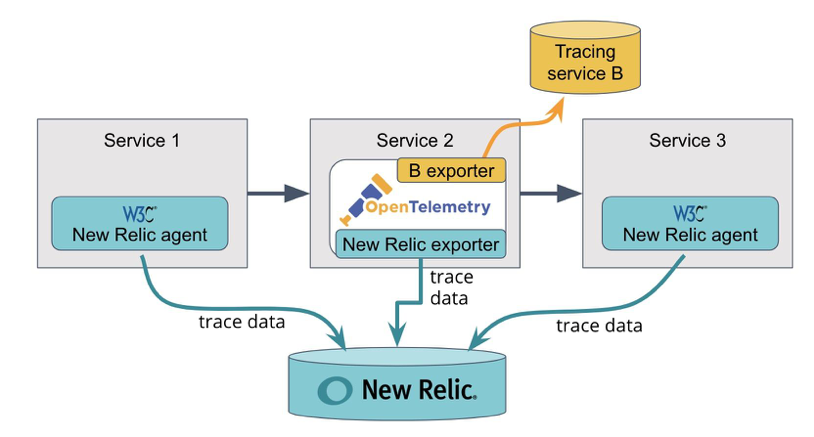
Scenario 2: Where all trace data is sent to New Relic
If you are using an open source tracer and want to send those traces to New Relic, we’ve created several exporters for popular open source monitoring tools, including OpenCensus and OpenTelemetry. We built the exporters using the Telemetry SDK, an open source set of API client libraries that send your trace data to the New Relic platform.
In this scenario, you could use an exporter for the OpenTelemetry tracer that is collecting trace data for Service 2 to send that data to New Relic, without interrupting your use of other exporters.

How does backwards compatibility work?
New Relic APM agents that support W3C Trace Context can accept and emit both the W3C Trace Context header format and the New Relic header format. The new agents are also backwards compatible, meaning they will continue to work with older agents, so trace context will be propagated between services with older and newer releases of New Relic agents.
In some cases, you may have services involved in a trace that are instrumented with something other than New Relic agents. As long as that instrumentation is compliant with W3C Trace Context, you can use any New Relic agent version that supports W3C Trace Context as part of that trace and be assured that the trace will be propagated.
If you have a trace with a mix of older and newer New Relic agents, and non-New Relic instrumentation that is compliant with W3C Trace Context, traces can still be propagated. You just need to ensure that W3C Trace Context-compliant New Relic agents are adjacent to the pre-W3C Trace Context New Relic agents. The New Relic agents that support W3C Trace Context will act as a “translator” for the New Relic proprietary trace context.
For example, this trace includes an OpenTelemetry agent, a W3C-compliant agent, and a non-compliant agent, yet the trace context can still be propagated:
New Relic agents will always accept and emit the W3C trace header format, and it takes priority over the New Relic trace header format. You can optionally disable the New Relic trace header format in the agent’s configuration file. See the documentation for instructions on disabling the New Relic format.
And for details and limitations on backward compatibility, see the New Relic distributed tracing documentation.
More than just another boring protocol
We have been closely involved with our colleagues across the industry as part of the W3C Distributed Tracing Working Group to get this specification to this point of final ratification. We are all very excited to be able to implement it.
New Relic is committed to the W3C group, and we’ll continue to provide composable instrumentation solutions that seamlessly work with open standards. We’ll also add support for more distributed tracing use cases to help our users improve observability throughout their DevOps lifecycle.
In the meantime, we’d love to hear from you and learn about how you’re leveraging W3C Trace Context and our open source exporters. Drop us a line in our GitHub exporter spec repo.
Upgrade your agents, and get started with the open New Relic One platform today!
Want to learn more about why you need an open, connected, and programmable platform for observability? Check out our ebook, The Age of Observability.
本ブログに掲載されている見解は著者に所属するものであり、必ずしも New Relic 株式会社の公式見解であるわけではありません。また、本ブログには、外部サイトにアクセスするリンクが含まれる場合があります。それらリンク先の内容について、New Relic がいかなる保証も提供することはありません。


