はじめに
去る2022年12月15日、Google CloudのVPC flow logsとの連携サポートが発表されました。
本機能の大きな特徴は次の4つです。
- New Relic で VPC 内のネットワークトラフィックを監視し、アラートできる
- 毎秒のバイトやパケット、各 TCP または UDP ポートの毎秒のアクセプトやリジェクトなどのネットワークパフォーマンスメトリクスを視覚化できる
- フローログの偏差を調査し、ネットワークのボリュームや健全性における予期せぬ変化を追跡できる
- 過度に制限されたセキュリティ・グループ・ルールや悪意のあるトラフィックの可能性のある問題を診断できる
これから、実際に設定し、使うまでの流れを解説します。
事前準備
本記事では実際にUIより提供される操作手順にあわせ、Google Cloud側の設定はCLIで行います。 あらかじめterminalなどでgcloudコマンドが実行できるよう設定しましょう。
※CLIとは別にterraformによる設定手順も提供されます。ご自身が管理する環境に合わせ、選択ください。
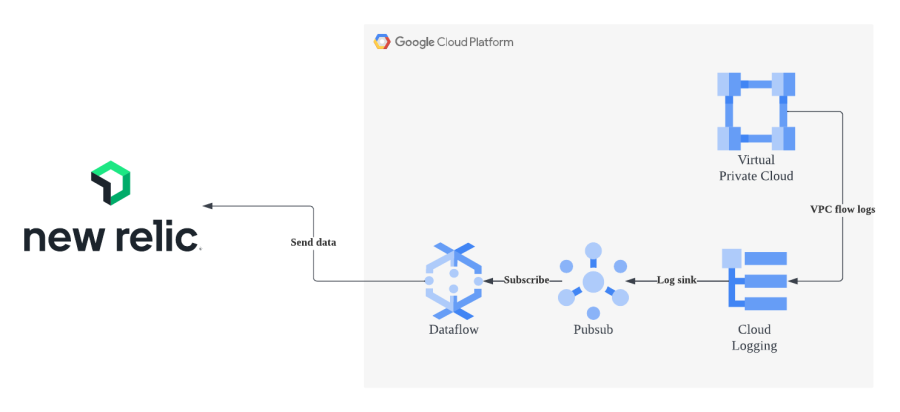
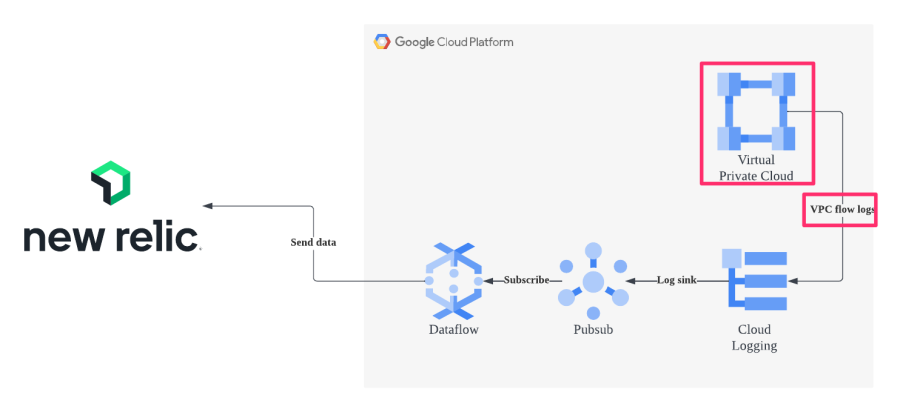
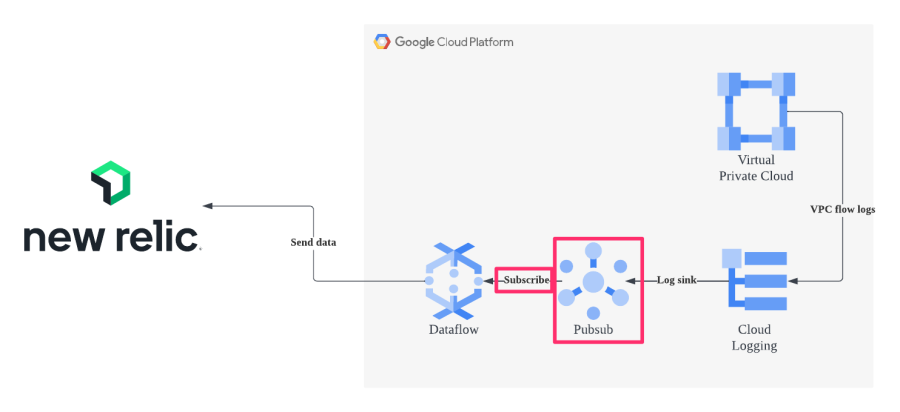
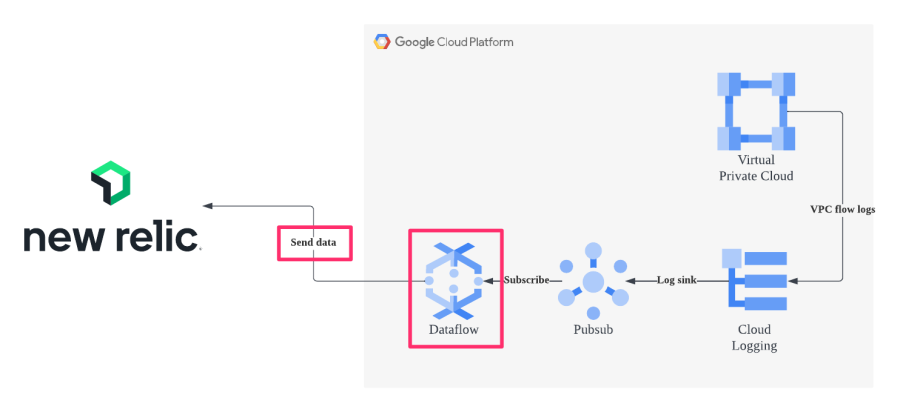
VPC flow logsのログ転送ではCloud Pub/Sub及びCloud Dataflowを利用します。 APIが有効になっていない場合は、あらかじめ有効にします。
参考画像:VPC Flow Logs ログ連携アーキテクチャ
両サービスはCLIから下記のコマンドで有効化できます。
gcloud services enable pubsub
gcloud services enable dataflow
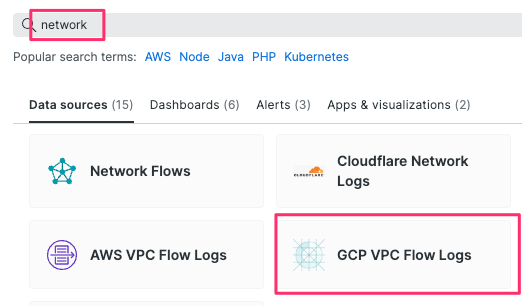
- Select your data よりGCP VPC Flow Logsを選択
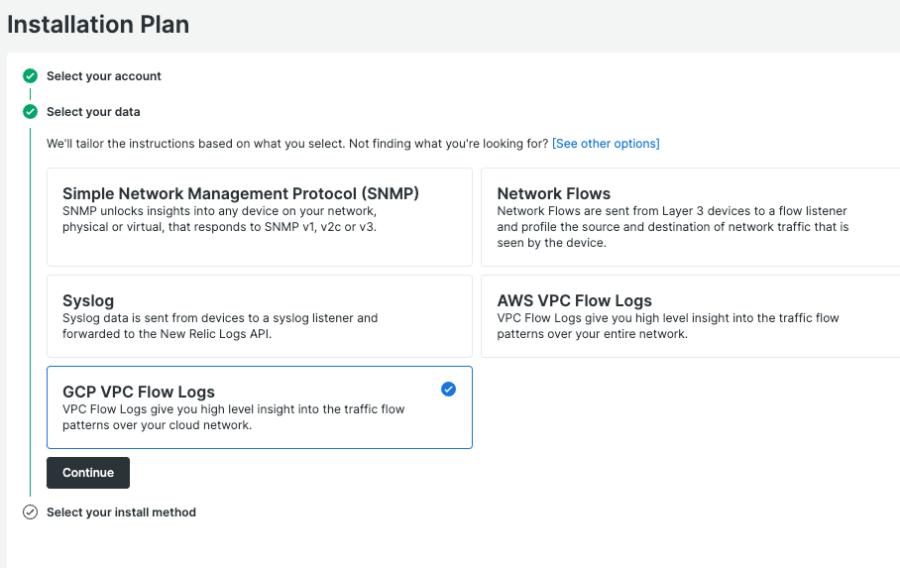
- GCP Projectに対象となるgcp project idを、Regionに対象リージョンをそれぞれ設定
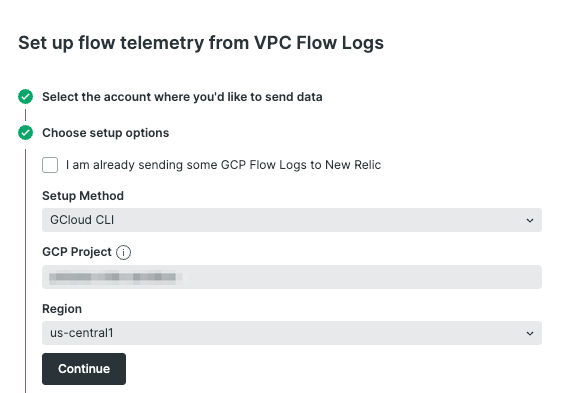
- VPC flow logsの有効化
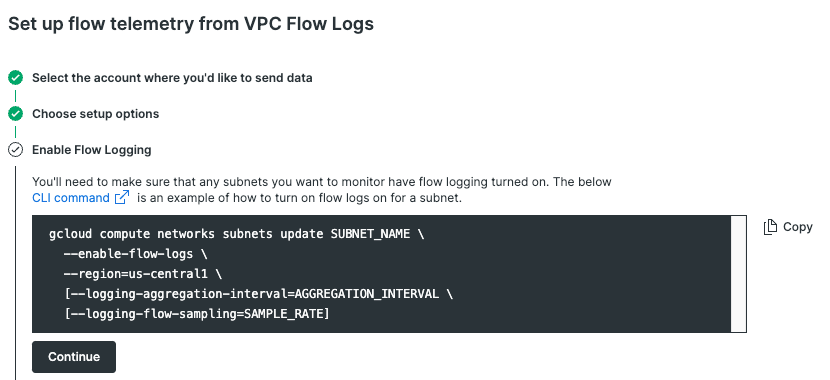
提示されたcommandを実行し、対象リージョンにあるsubnetのVPC flow logsを有効化します。
※提示されたcommandのうち、SUBNET_NAME, (AGGREGATION_INTERVAL, SAMPLE_RATE)はそれぞれ手動で記入する必要があります。
SUBNET_NAME: 対象サブネット名
AGGREGATION_INTERVAL: インターバル(デフォルト 5秒)
SAMPLE_RATE: ログのサンプリングレート(デフォルト 50%)
※データの流量が多くおおまかな情報が取れれば良い場合はデフォルトの50%で、セキュリティ上詳細な情報が欲しいなど要件に応じて割合を調整しましょう
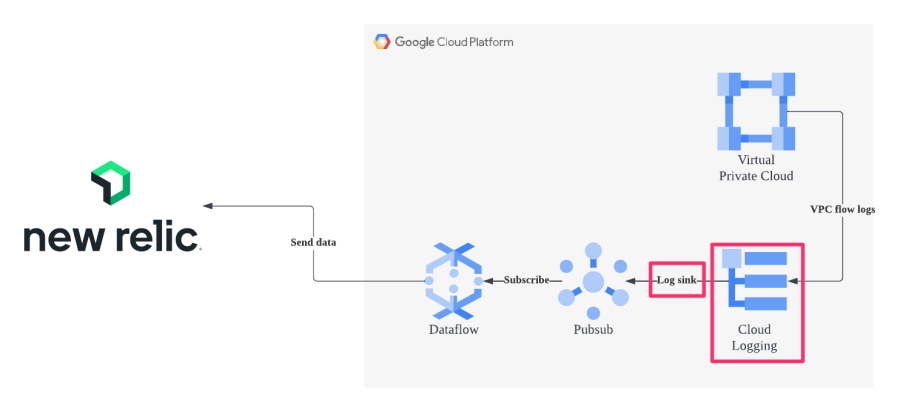
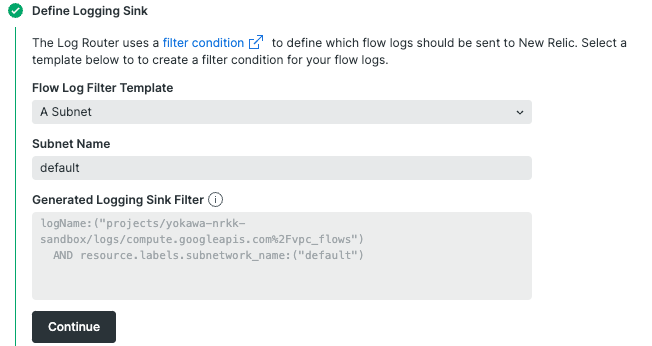
- Cloud LoggingからCloud Pub/SubへのSinkを設定
今回の例では、一つのsubnetのみを対象とします。
Flow Log Filter Template: A Subnet を選択します。
Subnet Name: 対象のsubnet_nameを入力します。
※Sink Filterのcommandが表示されますが、確認用となり手順5の段階では使用しません。
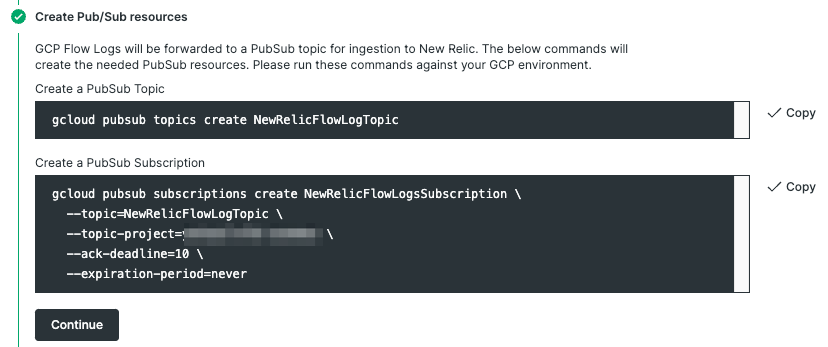
- Pub/Subのリソース作成
表示されたcommandを実行し、Topic及びSubscriptionを作成します。
- LoggingのSinkを作成
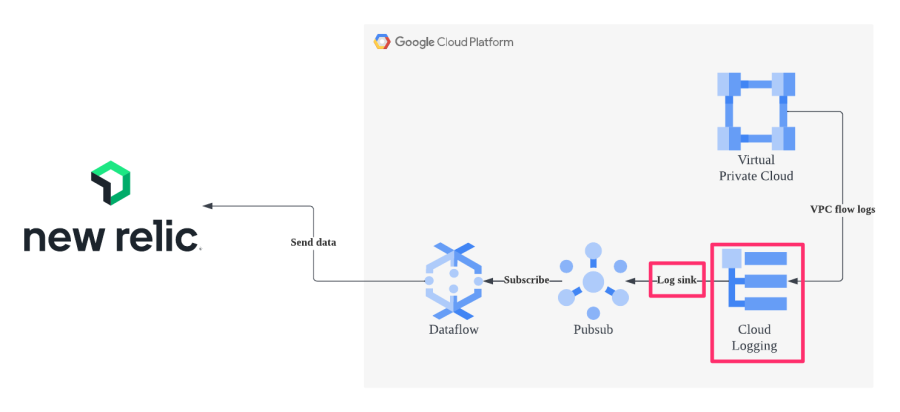
LoggingからPub/Subへ転送するルールを作成します。

- Pub/Subのpermissionを設定


表示されたcommandを実行し、返ってきた結果 "serviceAccount:p************-*****@gcp-sa-logging.iam.gserviceaccount.com" を Copy the writer identity from the above command here.にペーストします。
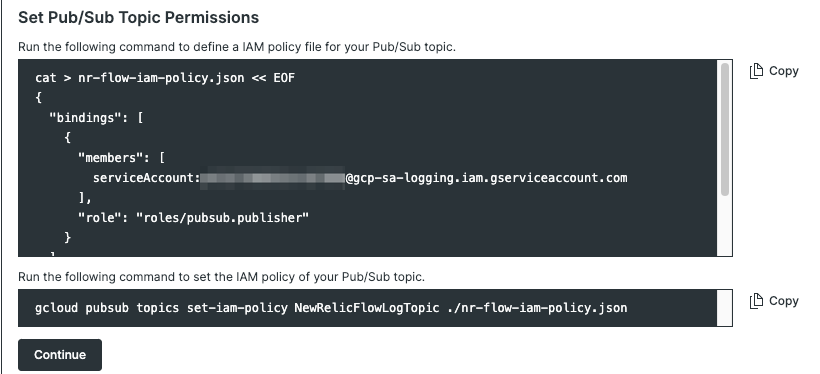
それぞれcommandを実行し、service accountが補完された形でjsonに吐き出されますので、ポリシーとして設定します。
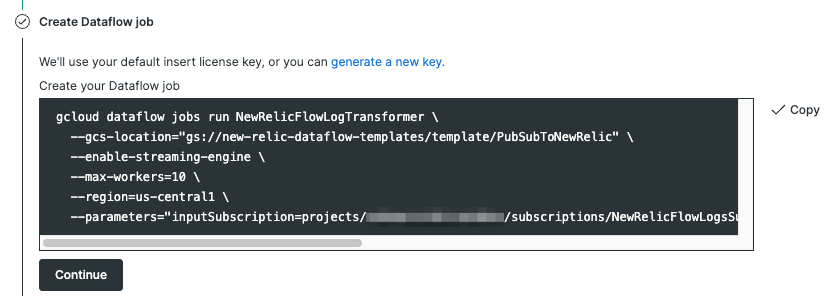
- Dataflow jobの作成
commandを実行し、Dataflow jobを作成します。
以上で設定は完了です。
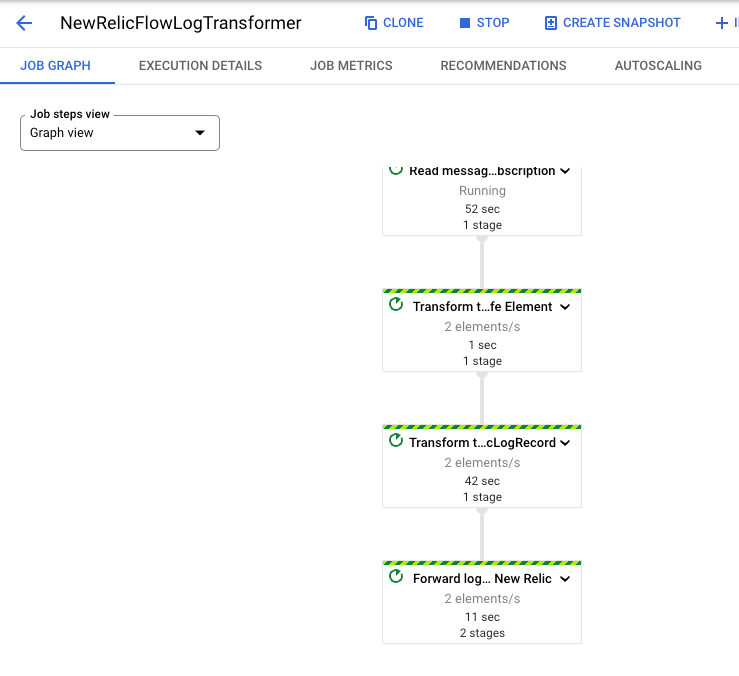
ここまで正常に実行できていれば、Google CloudのWebコンソールなどで対象のDataflow jobのStatusがRunningとなり、JOB GRAPHでもデータが流れていることを確認できます。
それでは、実際にどのようにビジュアライズされるか見ていきましょう
GCP VPC Flow Logs
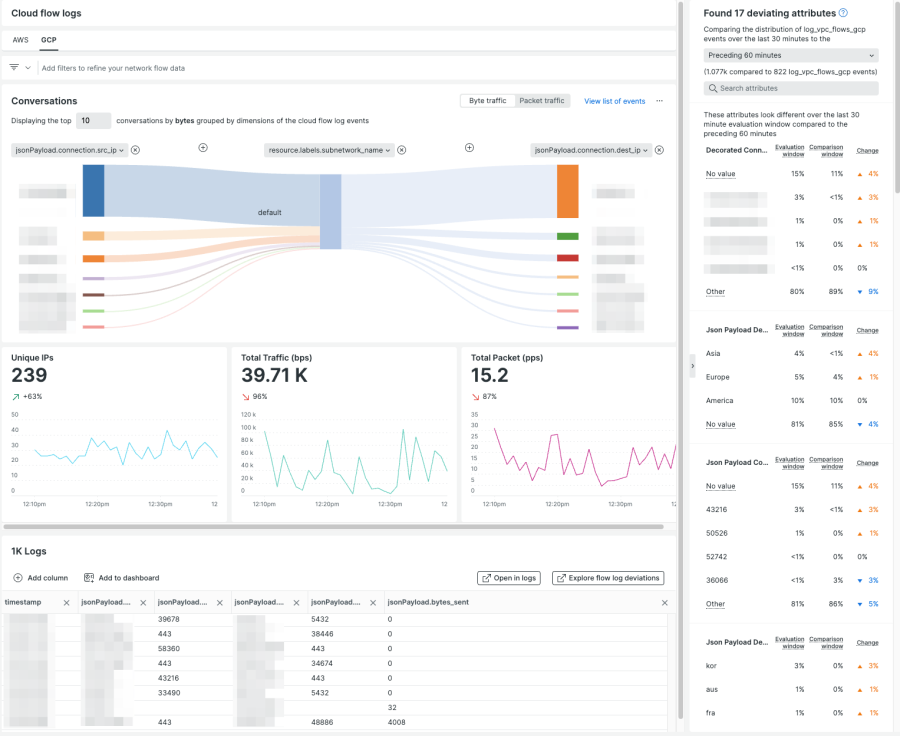
画面中央丈夫のConversationsはデフォルトでsource ip、subnet、dest ipの情報が可視化されます。
この図では一番上のsource ipからのトラフィックが大半を占めているということが一目でわかるかと思います。
まとめ
ConversationsではportなどVPC Flow Logに含まれるさまざまな情報も含めて可視化することができます。
例えば「特定のVMに対してのみとあるプロトコルのトラフィックが集中している」ようなケースでも直感的に見分けることの助けとなります。
その他にもTotal Trafficをはじめとしたグラフ類やログなどさまざまな情報がひとつの画面に収められています。
VPC Flow Logをご活用いただき、ネットワークを起点にボトルネックの検出やMTTxの短縮など幅広い分野でご活用いただけますと幸いです。
次のステップ
New Relicをまだお使いでない場合には、無料でNew Relicを使い始めることができます。無料アカウントには、毎月100GBの無料データ取込み、1名の無料フルアクセスユーザー、および無制限の無料ベーシックユーザーが含まれます。
本ブログに掲載されている見解は著者に所属するものであり、必ずしも New Relic 株式会社の公式見解であるわけではありません。また、本ブログには、外部サイトにアクセスするリンクが含まれる場合があります。それらリンク先の内容について、New Relic がいかなる保証も提供することはありません。

