Editor’s Note: A previous version of this post ran in July on the AWS Big Data Blog.
With the new launch of New Relic One, we are thrilled to formally announce many of the great innovations demonstrating our partnership with AWS and commitment to providing customers with an open, programmable platform for all their telemetry data.
Log management with New Relic has never been easier or more affordable. The first 100 GB ingest is free—for life! And additional data is priced at just 0,40 $/GB of ingestion per month to ensure customers can easily standardize on a single unified platform for visibility into all their data.
As part of that commitment, New Relic has made it even easier for our customers to ingest data from Amazon Kinesis Data Firehose.
New Relic One + Amazon Kinesis Data Firehose
New Relic can now ingest data directly from Amazon Kinesis Data Firehose, expanding the insights New Relic can give you in to your cloud stacks, so you can deliver more perfect software. Kinesis Data Firehose is a fully managed service for delivering real-time streaming data to AWS services like Amazon Simple Storage Service (Amazon S3), Amazon Redshift, and a wide array of external destinations.
As software teams have been forced to adopt disconnected monitoring tools for their infrastructure, applications, logs, and digital experience, it has created data silos that result in blind spots. Blind spots increase the amount of work required to switch between tools to uncover answers and make it harder to diagnose issues. New Relic One provides a connected real-time view of all your data in one place. New Relic’s open platform is designed to ensure easy ingestion and analysis of all your telemetry data regardless of its source.
With the release of Kinesis Data Firehose HTTP endpoint delivery, you can easily configure data streams to automatically ingest and forward data to New Relic. You can also configure Kinesis Data Firehose to transform your data before delivering it. You don’t need to write applications, manage resources, or create AWS Lambda functions, which makes it easier to manage and estimate costs for your data based on data volume.
In this post, we demonstrate how to stream Amazon CloudWatch Logs data to New Relic using a Kinesis Firehose data delivery stream. We show you how to create and configure a data delivery stream to ingest CloudWatch logs and forward them to New Relic
Prerequisites
Before continuing, you will need a New Relic account and an Insights Insert API Key. You will also need to install and configure the AWS Command Line Interface (AWS CLI) to make the policy and role changes covered by the post. For instructions, see Installing the AWS CLI.
You will also need to make sure that your delivery stream has sufficient service-limit quotas to forward all your data. Kinesis Data Firehose has default quotas in place that vary depending on the Region. You can create a case with AWS to request a quota increase.
Creating a delivery stream
To begin, you need to create a delivery stream to ingest logs from CloudWatch Logs. Complete the following steps:
- Sign in to the AWS Management Console and navigate to Kinesis.
- Under Data Firehose, choose Create delivery stream.

- Enter a name for the delivery stream.
- For Source, select Direct PUT or other sources.

- Choose Next until you’re prompted to Select a destination and choose 3rd party partner.
- From the drop-down menu, choose New Relic.

- For New Relic HTTP API, add the following endpoint: https://aws-api.newrelic.com/firehose/v1.
- Enter your Insights Insert API Key in the API access token field.
- Configure Parameters.Parameters are inserted into every log that passes through the delivery stream, and can be queried against in New Relic Logs. As a best practice, we recommend including a logtype attribute to make sure your logs are parsed correctly in New Relic Logs. The
logtypeattribute defined here will appear in all your logs once reach New Relic. If you intend to use thelogtypeattribute to determine which parsing rules are applied to your logs in New Relic, we recommend creating a separate delivery stream for each logtype. - Configure and review the remaining settings as desired.
Validating the delivery stream configuration
We recommend that you confirm that your delivery steam forwards logs to your New Relic account by completing the following steps:
- On the Kinesis dashboard, choose Delivery Streams.
- Choose the delivery stream you created in the previous section.
- Expand Test with Demo Data and choose Start sending data.
- Wait 3–5 minutes for demo data to be written to your delivery stream.
- While you’re waiting, copy the Delivery Stream ARN—you need this to configure CloudWatch Logs to write to your delivery stream. If everything has been set up correctly, you should see demo data in your New Relic Logs account.
- Choose Stop sending demo data to avoid incurring additional usage charges.
Configuring CloudWatch Logs to write to Kinesis Data Firehose
Your next step is to configure CloudWatch to write logs to Kinesis Data Firehose. For more information, see Subscription Filters with Amazon Kinesis Data Firehose. For this post, we configure our delivery stream to forward logs to New Relic instead of Amazon S3.
We begin by creating an AWS Identity and Access Management (IAM) role that allows CloudWatch Logs to write data to your delivery stream. You can do this using the AWS Command Line Interface (AWS CLI).
- Use a text editor to create the following trust policy in a file (for example,
~/TrustPolicyForCWL.json). Make sure to replace us-east-1 with the Region containing your CloudWatch logs:
{ "Statement": { "Effect": "Allow", "Principal": { "Service": "logs.us-east-1.amazonaws.com" }, "Action": "sts:AssumeRole" } } - Use the create-role command to create an IAM role using your newly created policy:
  aws iam create-role \

       --role-name CWLtoKinesisFirehoseRole \

       --assume-role-policy-document file://~/TrustPolicyForCWL.json
Running the command returns the following code:
{ "Role": { "AssumeRolePolicyDocument": { "Statement": { "Action": "sts:AssumeRole", "Effect": "Allow", "Principal": { "Service": "logs.us-east-1.amazonaws.com" } } }, "RoleId": "AAOIIAH450GAB4HC5F431", "CreateDate": "2020-07-14T13:46:29.431Z", "RoleName": "CWLtoKinesisFirehoseRole", "Path": "/", "Arn": "arn:aws:iam::123456789012:role/CWLtoKinesisFirehoseRole" } } - Create a policy that allows CloudWatch to write logs to your delivery stream. As before, use a text editor to create a file (for example,
~/PermissionsForCWL.json) containing the following code:
{ "Statement":[ { "Effect":"Allow", "Action":["firehose:*"], "Resource":["arn:aws:firehose:region:123456789012:*"] }, { "Effect":"Allow", "Action":["iam:PassRole"], "Resource":["arn:aws:iam::123456789012:role/CWLtoKinesisFirehoseRole"] } ] } - Make sure to update the Region and AWS account ID placeholders in the preceding code with your account-specific details, and associate the policy with the role created at the beginning of this section. See the following code:
aws iam put-role-policy --role-name CWLtoKinesisFirehoseRole --policy-name Permissions-Policy-For-CWL --policy-document file://~/PermissionsForCWL.jsonAll required permissions should now be in place.
- The last step is to create a CloudWatch Logs subscription filter that determines which logs are written to your delivery stream and forwarded to New Relic. See the following code:
aws logs put-subscription-filter \

    --log-group-name "syslog" \

    --filter-name "Destination" \

    --filter-pattern "ERROR" \

    --destination-arn "arn:aws:firehose:region:123456789012:deliverystream/my-delivery-stream" \

    --role-arn "arn:aws:iam::123456789012:role/CWLtoKinesisFirehoseRole"
In the preceding code, replace the value of destination-arn with the ARN of the delivery stream you created at the beginning of this post. You also need to update the role-arn with the ARN of the CWLtoKinesisFirehoseRole you created earlier.
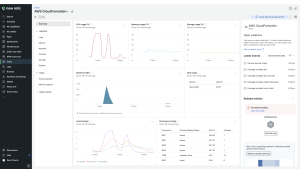
After you complete these steps, you can confirm that data is flowing in New Relic Logs. The following screenshot shows Kinesis Data Firehose delivering data to New Relic Logs.
Log Management in New Relic One
The Telemetry Data Platform provides full log management including the ability to search, filter, analyze, alert, and visualize your log data using the built-in functionality or open source tools already deployed in house.
For customers wanting more out-of-box curated content, New Relic One also provides Full-Stack Observability. With Full-Stack Observability, curated content across your entire stack is available for applications, infrastructure, digital experience monitoring, and more. Errors, traces, and spans have logs automatically correlated for deeper and faster root cause analysis
New Relic One also provides the option of Applied Intelligence, which leverages machine learning for proactive detection before an incident occurs and incident intelligence to reduce alert fatigue
Conclusion
In this post, we showed you how to automatically ingest and forward CloudWatch Logs data into New Relic using a Kinesis Data Firehose HTTP endpoint. We hope you will use this knowledge to expand the use of data streams in your organization to deliver more perfect software faster.
Curious to know what working with New Relic is like? See our collaboration with ZenHub.
Colin Bookman, ISV Sr. Solutions Architect at AWS, also contributed to this post.
Die in diesem Blog geäußerten Ansichten sind die des Autors und spiegeln nicht unbedingt die Ansichten von New Relic wider. Alle vom Autor angebotenen Lösungen sind umgebungsspezifisch und nicht Teil der kommerziellen Lösungen oder des Supports von New Relic. Bitte besuchen Sie uns exklusiv im Explorers Hub (discuss.newrelic.com) für Fragen und Unterstützung zu diesem Blogbeitrag. Dieser Blog kann Links zu Inhalten auf Websites Dritter enthalten. Durch die Bereitstellung solcher Links übernimmt, garantiert, genehmigt oder billigt New Relic die auf diesen Websites verfügbaren Informationen, Ansichten oder Produkte nicht.


