Today at KubeCon North America, we announced one-step observability for Kubernetes to address the key monitoring challenges developers face in managing dynamic Kubernetes environments. The New Relic Intelligent Observability Platform automatically instruments application performance monitoring (APM) with Kubernetes deployments, eliminating the need for additional configurations. We provide AI-strengthened insights and out-of-the box dashboards and views to manage Kubernetes workloads faster. This ultimately speeds up incident resolution and improves developer productivity.
Solving Kubernetes observability challenges with one-step instrumentation
Kubernetes is an open-source system for automating the deployment, scaling, and management of containerized applications. Kubernetes is increasingly popular for driving innovation and cost efficiency and as an enabler for organizations embracing microservices architectures, helping engineers to spin containers up and down as needed. However, monitoring the performance of applications deployed on Kubernetes poses challenges and requires developer and platform teams to install APM and Kubernetes integrations separately to achieve observability across applications and Kubernetes clusters—often a cumbersome and time-consuming process. We offer intelligent observability that automatically instruments APM with Kubernetes, while providing AI-strengthened insights.
Purpose-built for faster, smarter performance monitoring
We provide complete visibility across applications and Kubernetes workloads, enabling teams to quickly identify and resolve issues. This results in maximum uptime, reliability, and performance—boosting customer satisfaction and ultimately driving revenue for the business.
Key features and benefits include:
- One-step instrumentation: One-step instrumentation simplifies instrumentation with APM-Auto attach. This automates APM instrumentation alongside Kubernetes deployments. Using a Helm chart, users can simplify the installation and initial setup for auto-instrumentation, significantly reducing deployment friction. Additionally, APM auto-attach automatically upgrades APM agents to the latest, ensuring teams can accurately manage the performance of their Kubernetes clusters together with the application.
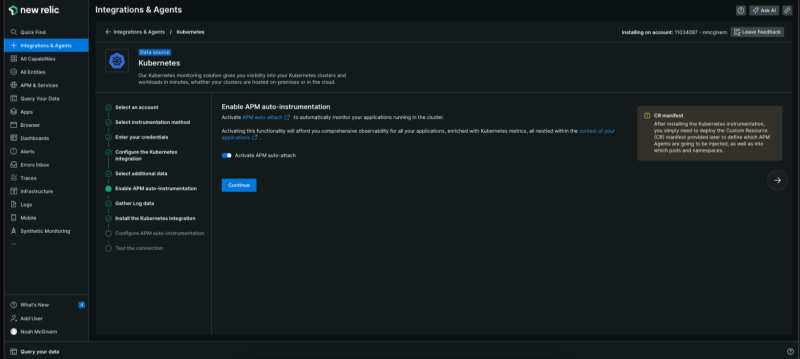
Auto-instrument APM with New Relic.
- AI-strengthened out-of-the-box insights: Pre-configured Kubernetes UI, alerts, and troubleshooting capabilities allows teams to correlate application and Kubernetes data on a unified interface to quickly identify and resolve performance issues.
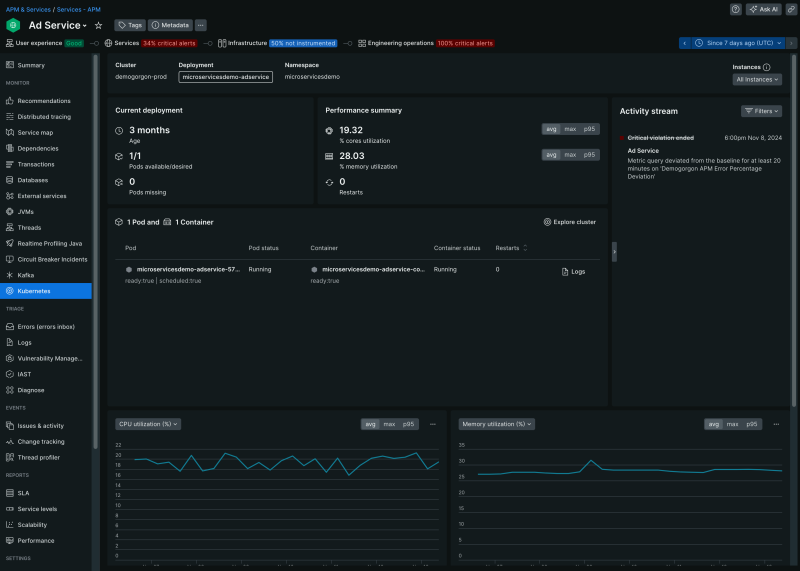
AI-strengthened out-of-the-box insights
- Native support for OpenTelemetry (OTel) and Prometheus: Unifies OTel-instrumented Kubernetes clusters and Prometheus-instrumented hosts alongside all telemetry data to eliminate fragmentation and blind spots and facilitate rapid onboarding, automated correlation, and out-of-the-box insights within a native UI. It also includes:
- Native UIs populated with OTel and Prometheus-generated golden metrics.
- Automated correlation between applications and Kubernetes infrastructure, even if the applications are instrumented with New Relic and Kubernetes is instrumented with OTel or vice versa.
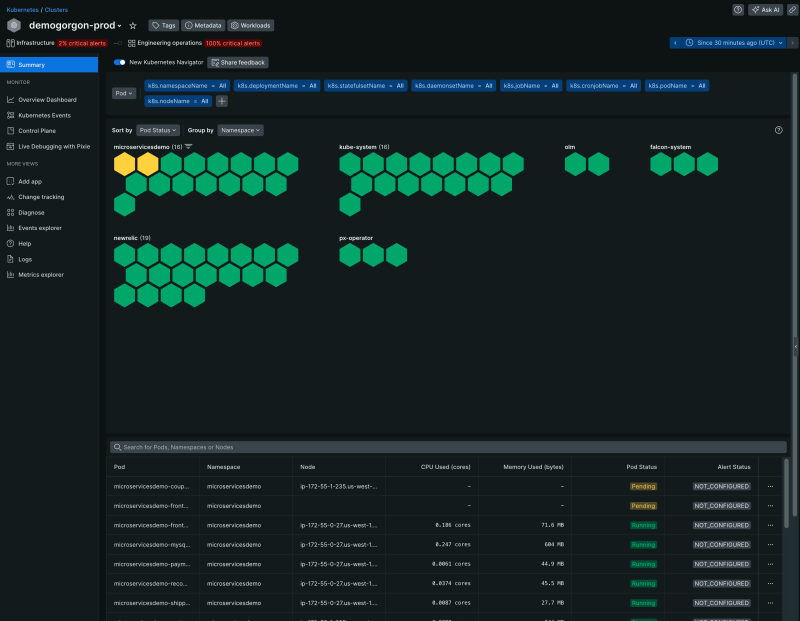
Native support for OpenTelemetry (OTel) and Prometheus
- Democratize observability with New Relic AI: Users of any role or skill level can easily access insights and take action through natural language prompts, making observability accessible to all.
“Modern organizations are embracing Kubernetes to drive innovation and efficiency gains, but this often comes with trade-offs in performance management,” New Relic Chief Product Officer Manav Khurana. “New Relic simplifies observability workloads for Kubernetes environments so that developer and platform teams can more easily monitor their stacks—all with intelligent insights driven by our AI-strengthened Intelligent Observability platform.”
次のステップ
- Learn more on our webpage.
- New Relic one-step observability for Kubernetes is available to all customers. Get started for free here.
- Join New Relic at KubeCon North America at booth #A3 for insights and expert help to transform your business.
本ブログに掲載されている見解は著者に所属するものであり、必ずしも New Relic 株式会社の公式見解であるわけではありません。また、本ブログには、外部サイトにアクセスするリンクが含まれる場合があります。それらリンク先の内容について、New Relic がいかなる保証も提供することはありません。

