There’s an old truth in software development that your backup is only as good as your last restore. Something similar can be said for your observability platform: You don’t really know how good it is until your system hits a snag, and you can correlate spikes on your dashboards with real system activity.
New Relic Solution Architects work with customers to build out best practices for using our platform. When we’re in these customer engagements, we can’t wait around for an outage to show them New Relic in action. Recently, though, we had the opportunity to manufacture a controlled outage with some chaos engineering. With a little help from our friends at Gremlin, we were able to demonstrate for a customer the value of New Relic’s observability platform in the face of chaos.
Chaos engineering with Gremlin
Chaos engineering is the practice of facilitating controlled experiments to uncover weaknesses in your system. These experiments temporarily stress your system to simulate how it responds in different conditions. The goal is to identify issues before they become a problem for your users. Ideally, at Gremlin, you achieve this with four steps:
- Prepare for disaster with good site reliability practices and observability
- Run automated tests in production
- Inject chaos in no-production systems
- Inject automated chaos everywhere
Gremlin is the leading Chaos Engineering platform. With Gremlin, you can run chaos experiments safely and securely across every layer of your platform and application infrastructure. You can run experiments that add latency, drop network traffic with blackholes, shut down hosts, spike CPU usage, attack DNS, and plenty more.

In other words, you can stress different parts of your systems in a safe, controlled manner. But when you pair Gremlin with New Relic, you get deep visibility into the behavior of your systems as they’re attacked.
Gremlin and New Relic: solving real customer problems
Recently, we had the opportunity to team up with Gremlin to help a customer experiencing random issues that resulted in their users not being able to log in to their corporate network or applications. To help them get ahead of these issues and to build out the right alerting, incident management processes, and runbooks, we ran a game day with the customer.
Don't miss: How To Run an Adversarial Game Day
A game day is essentially a fire drill. It’s an opportunity to practice a common, real world scenario in a safe environment. You break something and then observe how your teams react to the problems. Do the right people get alerted? Do your dashboards provide the right information? How does your team react? How quickly are they able to resolve the incident?
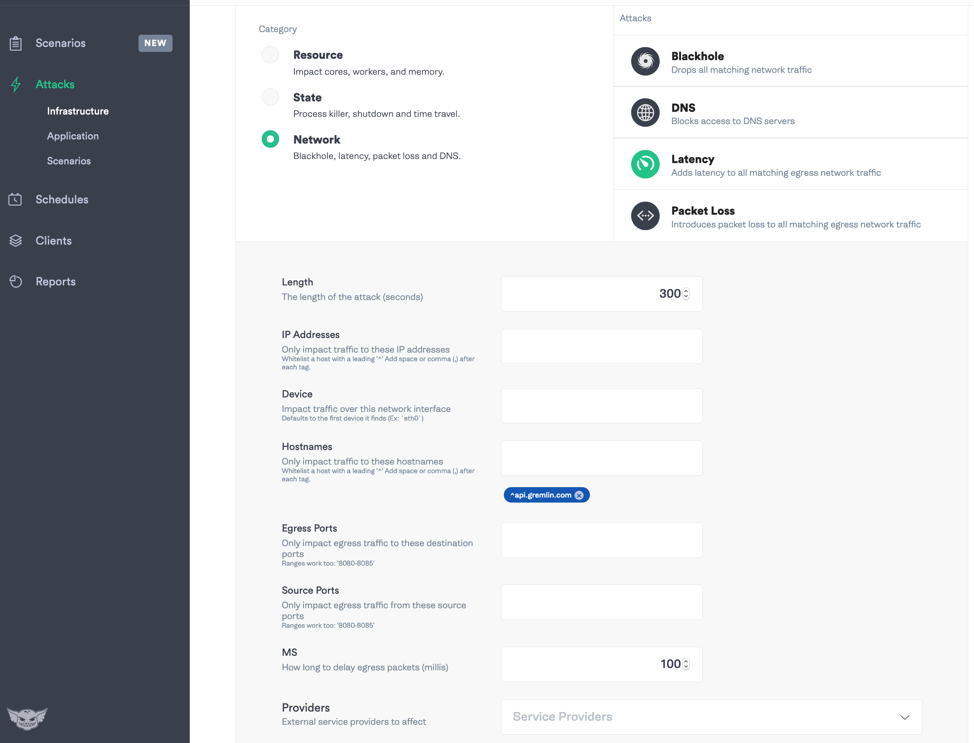
For this game day, we wanted to see what would happen to the customer’s Cassandra database if we added some latency. We started the game day by using Gremlin to add an additional 10 milliseconds of latency.
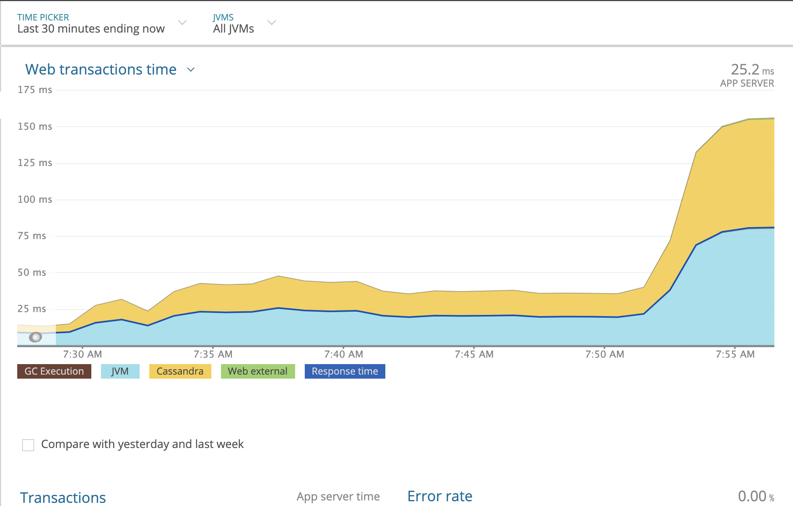
New Relic immediately recognized the latency and fired the appropriate alerts. In this screenshot you see multiple metrics correlated to one attack:
New Relic easily recognized the impact of 10 ms of latency, but, in the real world, that would be minimal for our customer’s users. So, we cranked it up to 100 ms of latency.
Then chaos hit.
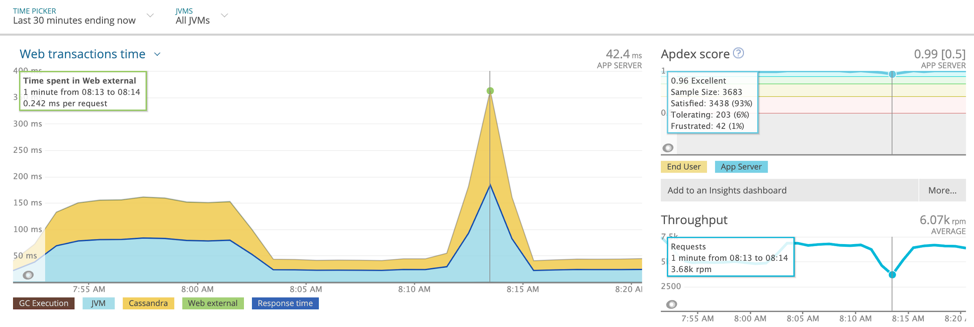
It started with some unexpected alerts from New Relic Synthetics: Multiple alerts fired due to an increase in response time:
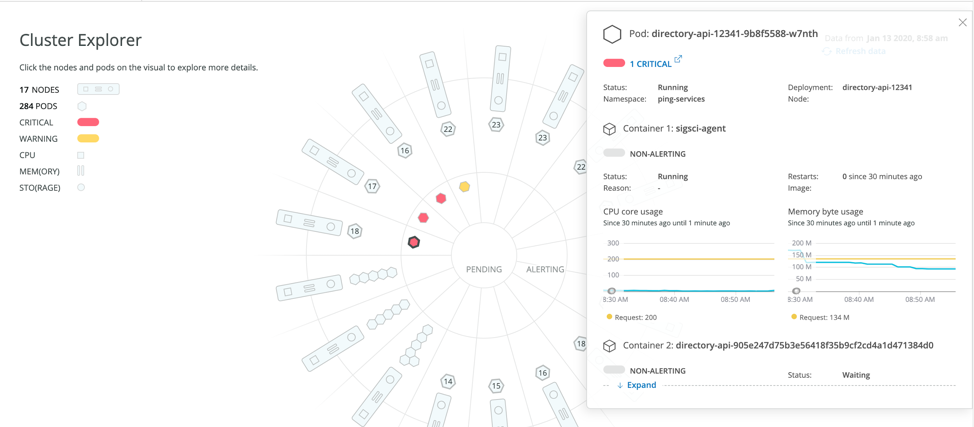
As the latency continued, we found some critical alerts firing in the customer’s Kubernetes cluster.
The latency had increased the memory usage for several pods in the cluster, which had hard memory limits.
The Cassandra latency we introduced rippled throughout the application—affecting everything from response time to the network to the cluster hosting the application—and had a significant impact on the end user experience. But with New Relic in place, our customer was able to see exactly how these failures traced directly back to their database.
Game days are all about teamwork
After the initial experiment, the customer followed up with latency experiments in their Kafka cluster and Amazon EC2 instances. In each of these scenarios, New Relic picked up the attack and alerted the right on-call teams. The responding teams were able to simulate hunting down the root cause in each of these situations and improved their incident response protocols. We ended the game day after 7 hours with a full retrospective, and a very happy customer.
Together, Gremlin and New Relic used this game day to identify a critical issue for the customer before it impacted their users. By using Gremlin to safely simulate real-world failure scenarios, the customer’s engineering and SRE teams gained confidence in New Relic’s monitoring and alerting, and honed their incident response protocols, lowering the time it takes them to identify and resolve issues.
In fact, at New Relic we use Gremlin to hone our systems and proactively find issues in our software before our users do. It’s an essential tool for any observability practice.
Learn how you can improve your incident response process with a robust incident-management action plan in Reducing MTTR The Right Way. If you’re interested in using New Relic features to collect data for your game day, read our docs tutorial about using New Relic to prepare for a peak demand event.
本ブログに掲載されている見解は著者に所属するものであり、必ずしも New Relic 株式会社の公式見解であるわけではありません。また、本ブログには、外部サイトにアクセスするリンクが含まれる場合があります。それらリンク先の内容について、New Relic がいかなる保証も提供することはありません。


