Recently, the New Relic Logs team partnered with Amazon Web Services (AWS) to support FireLens custom log routing for Amazon Elastic Container Service (ECS) environments. FireLens gives us the foundation for a fast, simple, and extremely efficient process to send your ECS log data to New Relic—a capability that gives your team additional visibility into the health and performance of your ECS environment.
We think this is a big step forward, in terms of making log data more accessible and useful for New Relic customers running ECS clusters. In this post, we’ll look more closely at how FireLens integrates with New Relic Logs, and we’ll walk you through the process of configuring and enabling FireLens for your own New Relic Logs environment.
What is FireLens?
FireLens for Amazon ECS enables you to define custom log routing within ECS task definitions. FireLens adds a sidecar container, leveraging Fluent Bit or Fluentd (two widely used, open source log aggregators) to function as a log router. You’ll also add a logging configuration to your existing application containers that tells the router where to send the logs for a particular container.
The process that FireLens supports can be immensely powerful for teams with complex log storage requirements in ECS environments. Other options are available to perform the same tasks—for example, implementing AWS CloudWatch with an integration that consumes log streams, or configuring a log forwarder at the image level—but none of them are as simple or work as efficiently at scale as FireLens.
Configuring FireLens
Enabling FireLens for New Relic Logs is a simple, two-part process:
First, you’ll configure the FireLens log router container definition, which will look similar to this one:
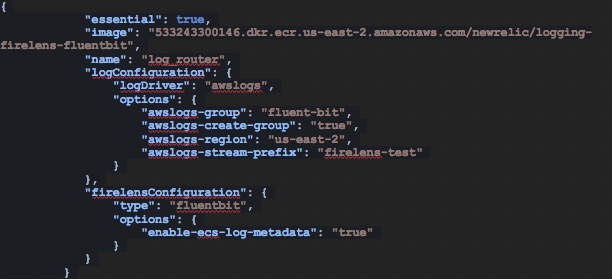
There are a few things to note here:
- We use the
essentialproperty to ensure that the task definition only runs if this log router container runs properly. (You don’t want to miss out on any of that valuable log data!) - New Relic offers custom images of its output plugin for 10 AWS geographic regions (four United States, one Canadian, and five EU regions). Be sure to choose the appropriate image for your desired region.
- We recommend that you use the awslogs driver for this container so you can see any issues that the log router may be having.
- Lastly, in the
firelensConfigurationproperty, be sure to specify which log forwarder you’re using (e.g., Fluent Bit). We also recommend that you enable ecs-log-metadata to get some free log decoration out of the box.
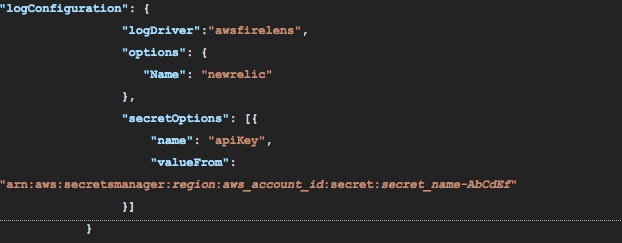
Next, you’ll set up the logging configurations for the application containers. You’ll add the following configuration property, which includes your New Relic Insights API key, to your existing container definitions:

It’s that simple! For better security, we recommend that you leverage the AWS Secrets Manager to store your API key, which looks like this:
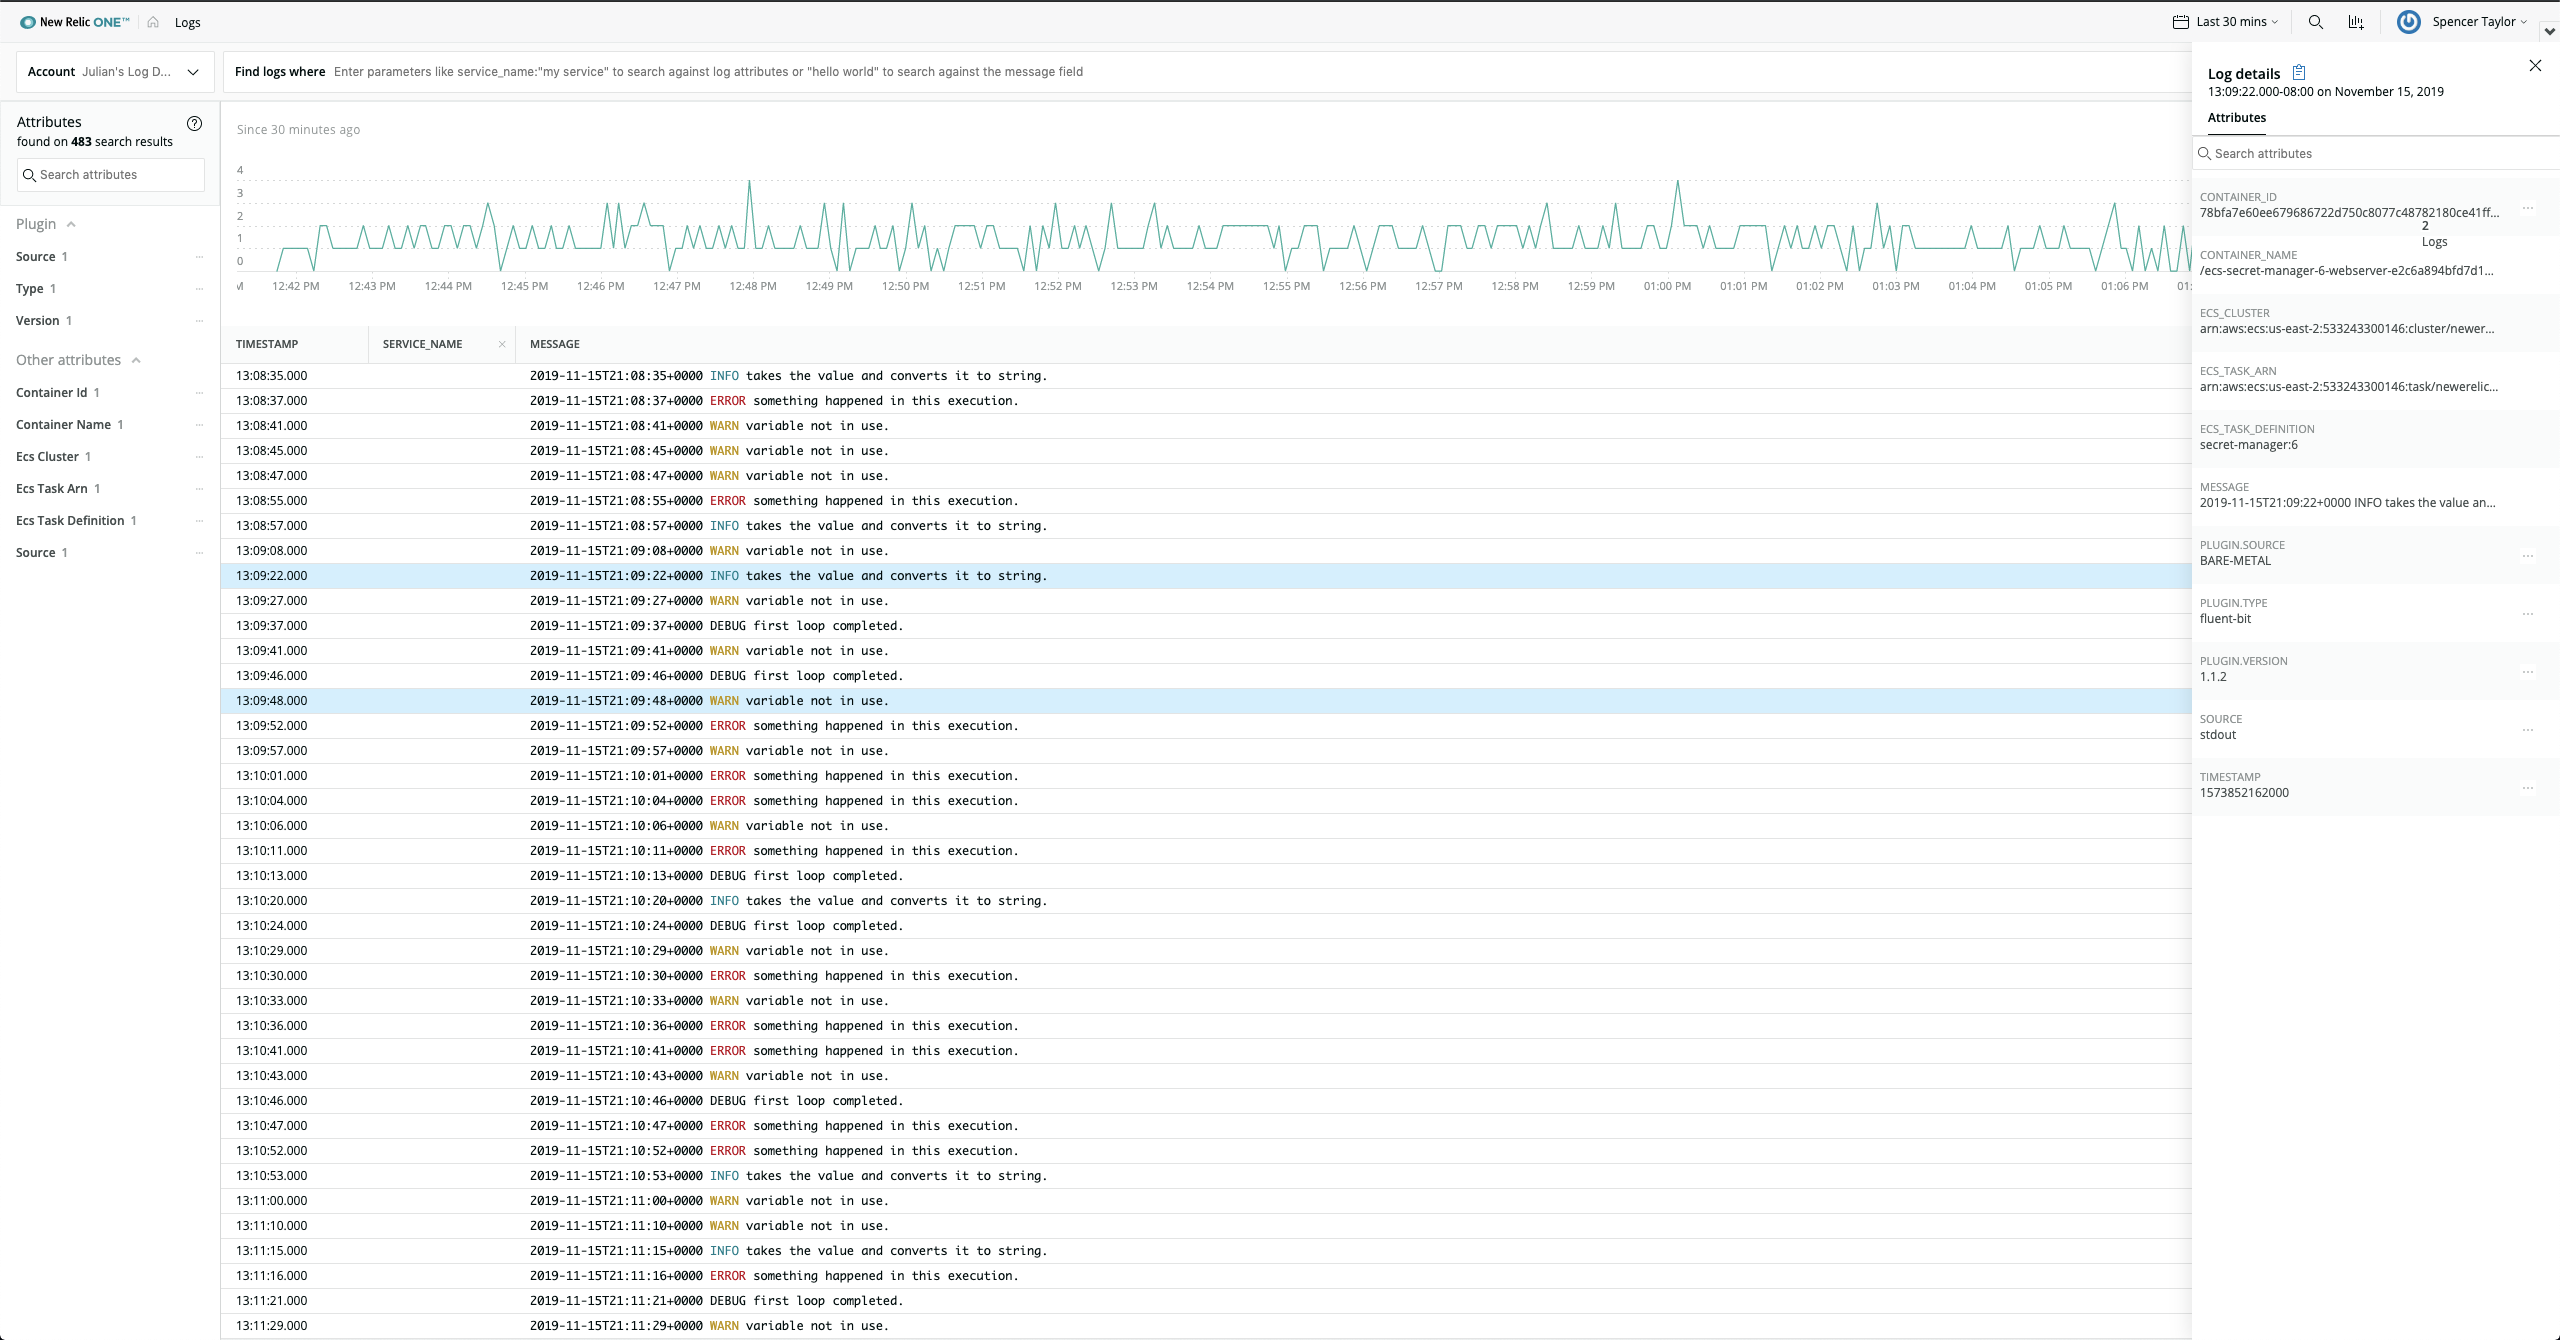
Once you’ve configured FireLens, it will begin generating and sending log data almost immediately from your ECS cluster. Wait a few minutes, check your account for data, and enjoy your rich new source of container performance insights!
Working with FireLens: requirements and next steps
To use New Relic Logs with FireLens, ensure that your New Relic environment includes the following:
- Active paid or trial New Relic Logs subscription.
- New Relic Insights Insert key
- Amazon EC2 Container Service (ECS) cluster
Once you have FireLens up and running, you’ll have no shortage of potential next steps. You can explore your data using the New Relic Logs UI; view contextual log data such as distributed tracing, stack traces, and applications; or query your data in New Relic Insights. Also, be sure to review our documentation to learn more about New Relic Logs for AWS FireLens, including detailed setup, configuration, and troubleshooting and log management tips.
Will you be at KubeCon in San Diego this week? Be sure to catch up with the New Relic team! You’ll find us at booth P12.
本ブログに掲載されている見解は著者に所属するものであり、必ずしも New Relic 株式会社の公式見解であるわけではありません。また、本ブログには、外部サイトにアクセスするリンクが含まれる場合があります。それらリンク先の内容について、New Relic がいかなる保証も提供することはありません。

