As modern technology environments become more distributed and complex, effectively managing their performance also becomes much more of a challenge. Understanding the collective behavior of your services and applications requires you to instrument all your frameworks and libraries in a standardized way.
Enter OpenTelemetry—an open source project sponsored by the Cloud Native Computing Foundation (CNCF) that provides a unified standard for service instrumentation. Formed by merging OpenTracing and OpenCensus, OpenTelemetry offers a single set of APIs and libraries that standardize how you collect and transfer telemetry data to distinct backends of your choice, such as New Relic.
Today New Relic is excited to announce the availability of our OpenTelemetry offerings. Now, when you ingest open source data into our Telemetry Data Platform and use Full-Stack Observability to quickly gain insights into the root cause of issues, you can optimize the performance and understand complex interactions of applications and services across your full estate.
Ingest OpenTelemetry data with ease
New Relic’s OpenTelemetry offerings give you multiple ways to ingest data:
- OpenTelemetry Collector: The OpenTelemetry Collector offers a vendor-agnostic implementation for how to receive, process, and export telemetry data. Since the collector can receive and export data in various formats, it is a great way to start when you have already-instrumented code. Enabling the New Relic Exporter in the OpenTelemetry Collector lets you send telemetry data to New Relic and is the preferred method for ingesting OpenTelemetry data into New Relic One.
- Language-Specific Exporters: The OpenTelemetry Collector aggregates and routes your data, but you also need something in process to instrument your services. The OpenTelemetry project has a number of language-specific SDKs and instrumentation libraries for instrumenting your services. You can send your telemetry data to the collector or directly to New Relic using language-specific exporters. We currently provide them for NET (1.0), Java, and Go.
- Java OpenTelemetry Integration Bundle: This is the easiest way to get started with OpenTelemetry and Java since it includes the Java SDK, the Java auto-instrumentation agent, and the New Relic exporter packaged together.
Quickly visualize and analyze data with New Relic’s OpenTelemetry UI
With Full-Stack Observability’s OpenTelemetry APM capability, you can visualize your entire stack’s performance data in context, get to the root cause faster, and deliver optimum performance for your application and a better digital experience for your customers.
Let’s walk through how you can use the New Relic Collector Exporter and the OpenTelemetry UI to collect, visualize, and analyze the C# cartservice that is part of the microservices demo application.
To instrument your application, add the following packages to it:
NewRelic.OpenTelemetryOpenTelemetry.Extensions.HostingOpenTelemetry.Instrumentation.AspNetCoreOpenTelemetry. Exporter.OpenTelemetryProtocolOpenTelemetry.Instrumentation.Http(optional for instrumenting external HttpClient calls)Other OpenTelemetry.Instrumentation.*packages that apply to your application (e.g., Sql)
Enable ASP.NET Core instrumentation when you start up the application, typically done in the ConfigureServices of your Startup class. The example below enables this instrumentation by using an extension method on IServiceCollection, which requires adding the package OpenTelemetry.Extensions.Hosting to the application. This ensures the instrumentation is disposed of when the host shuts down.
public void ConfigureServices(IServiceCollection services)
{
    ...
    services.AddOpenTelemetryTracing
     (builder => ConfigureOpenTelemetry(builder, cartStore));

    ...
}
Additionally, this service sets up the OpenTelemetry Collector exporter, which requires adding OpenTelemetry.Exporter.OpenTelemetryProtocol to the application and configuring the OTLP endpoint to point to where the exporter will send traces.
private static void ConfigureOpenTelemetry(TracerProviderBuilder builder, ICartStore cartStore)
{

   builder.AddAspNetCoreInstrumentation();
   if (cartStore is RedisCartStore redisCartStore)
   {
         builder.AddRedisInstrumentation(redisCartStore.ConnectionMultiplexer);
   }

   var exportType = Environment.GetEnvironmentVariable("NEW_RELIC_DEMO_EXPORT_TYPE") ?? "newrelic";
   var newRelicApiKey = Environment.GetEnvironmentVariable("NEW_RELIC_API_KEY");
   var newRelicTraceUrl = Environment.GetEnvironmentVariable("NEW_RELIC_TRACE_URL");
   var serviceName = "CartService" + (exportType == "newrelic" ? string.Empty : $"-{exportType}");


      builder.SetResourceBuilder(ResourceBuilder.CreateDefault().AddService(serviceName, null, null,
      false, $"{exportType}-{Guid.NewGuid().ToString()}"));


   switch (exportType)
   {
         case "otlp":
               var otlpEndpoint =
   Environment.GetEnvironmentVariable("OTEL_EXPORTER_OTLP_SPAN_ENDPOINT")??
   Environment.GetEnvironmentVariable("OTEL_EXPORTER_OTLP_ENDPOINT");
   Builder.AddOtlpExporter(options => options.Endpoint = otlpEndpoint);
   Break;

   ...
   ...
   ...

      }

   }
When you run the microservices demo, an OpenTelemetry collector automatically spins up at port 4317, which is defined in the buildargs of skaffold.yaml file for the cartservice to use.
- image: cartservice
       context: src/cartservice
       docker:
       buildArgs:
             NEW_RELIC_DEMO_EXPORT_TYPE: "{{.NEW_RELIC_DEMO_EXPORT_TYPE}}"
             NEW_RELIC_API_KEY: "{{.NEW_RELIC_API_KEY}}"
             NEW_RELIC_TRACE_URL: "{{.NEW_RELIC_TRACE_URL}}"
             NEW_RELIC_METRIC_URL: "{{.NEW_RELIC_METRIC_URL}}"
             OTEL_EXPORTER_OTLP_SPAN_ENDPOINT: "otel-collector:4317"
Analyze the app data
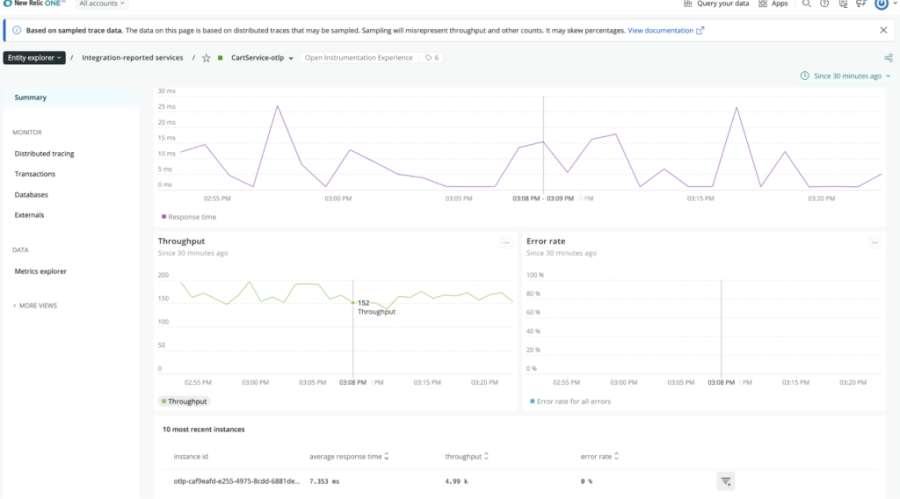
You can now start analyzing your .NET application data on New Relic One, as shown below in the summary window for the cartservice revealing the golden metrics: response time, throughput, and error rate—which you can narrow down if the service has an issue.

When you notice a surge in the response time or error rate, use the transactions page to identify the transaction that may be causing the problem.

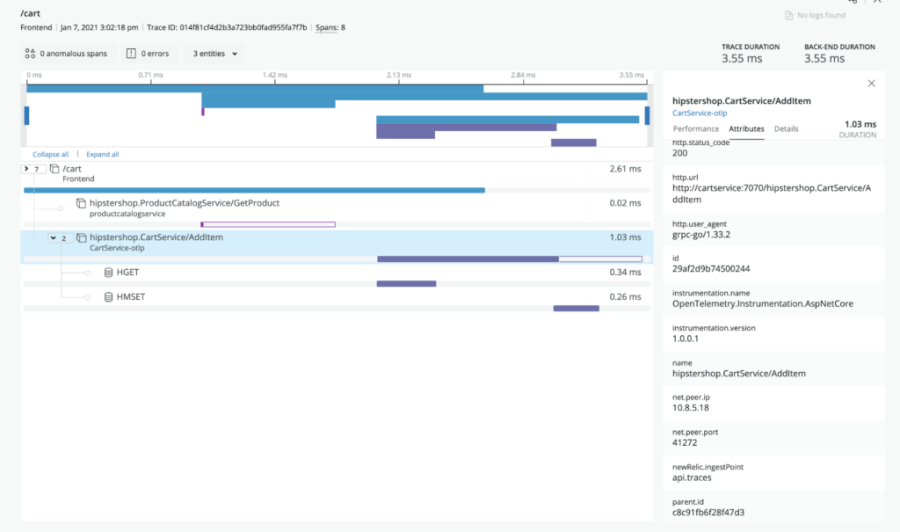
And drill down further by clicking on a particular transaction trace for a detailed end-to-end view of the request as it travels across the services and layers—all with the context you need to troubleshoot issues faster.

OpenTelemetry’s growth
OpenTelemetry .NET reaching v1.0.1 is a huge milestone for OpenTelemetry and is a testament to the broad and growing acceptance of OpenTelemetry. New Relic is excited to be one of the major contributors to the OpenTelemetry project and will continue our contributions and investments to ensure that both traces and metrics for all languages reach this huge milestone soon.
In addition, to help you easily adopt OpenTelemetry, we will evolve our ingestion methods and user experiences with more observability features and functionality. As when we first launched New Relic One, please send us feedback about the user interface by clicking the comment icon.
次のステップ
Try out New Relic One and its OpenTelemetry features by signing up for our perpetually free tier today.
本ブログに掲載されている見解は著者に所属するものであり、必ずしも New Relic 株式会社の公式見解であるわけではありません。また、本ブログには、外部サイトにアクセスするリンクが含まれる場合があります。それらリンク先の内容について、New Relic がいかなる保証も提供することはありません。


