Smarter Detection
Continuous, Automatic Anomaly Detection
Always know exactly what’s happening across your system by continuously evaluating your telemetry data. Notifications can be sent directly to your collaboration tools, so you’ll troubleshoot faster and prevent anomalies from becoming issues.
A Single View and Analysis for All Anomalies
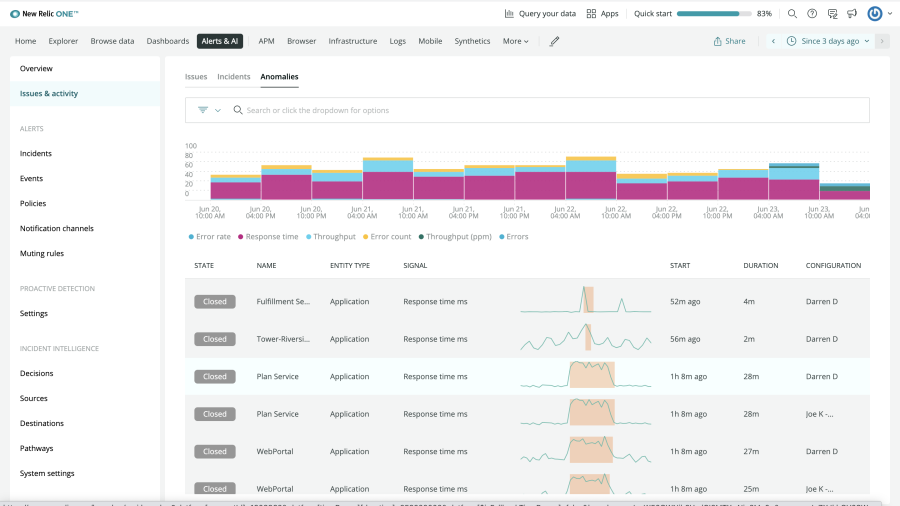
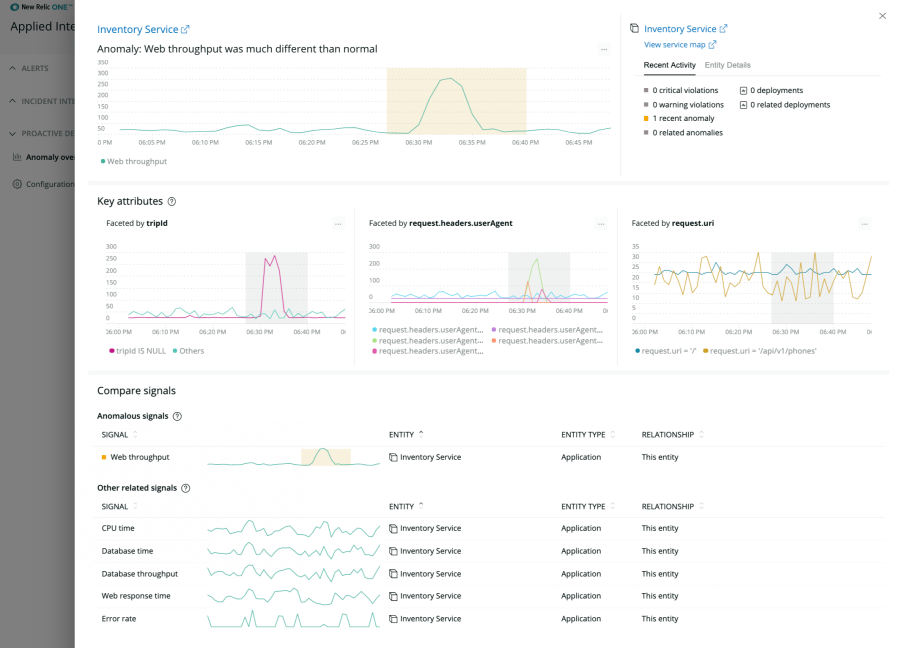
One place to see what’s happening across your environment in a simple list view of all anomalies. With easy access to critical analysis of each anomaly, you can see what caused spikes and view related signals to look at what happened around the anomaly so you can determine the root cause. Even see upstream and downstream dependencies, so you can keep your system running smoothly.
Visualize and Investigate Changes in Real Time
See a system-wide view of every change in any signal that matters to you—from application golden signals, to CPU usage, even changes in shopping cart transactions or user demographics. Then quickly figure out the root cause by seeing related services, errors, traces and abnormal history, right at your fingertips.
Discover network anomalies across your golden signals with zero configuration.
Real-Time Failure Warnings and Integrations with Collaboration Tools, like Slack
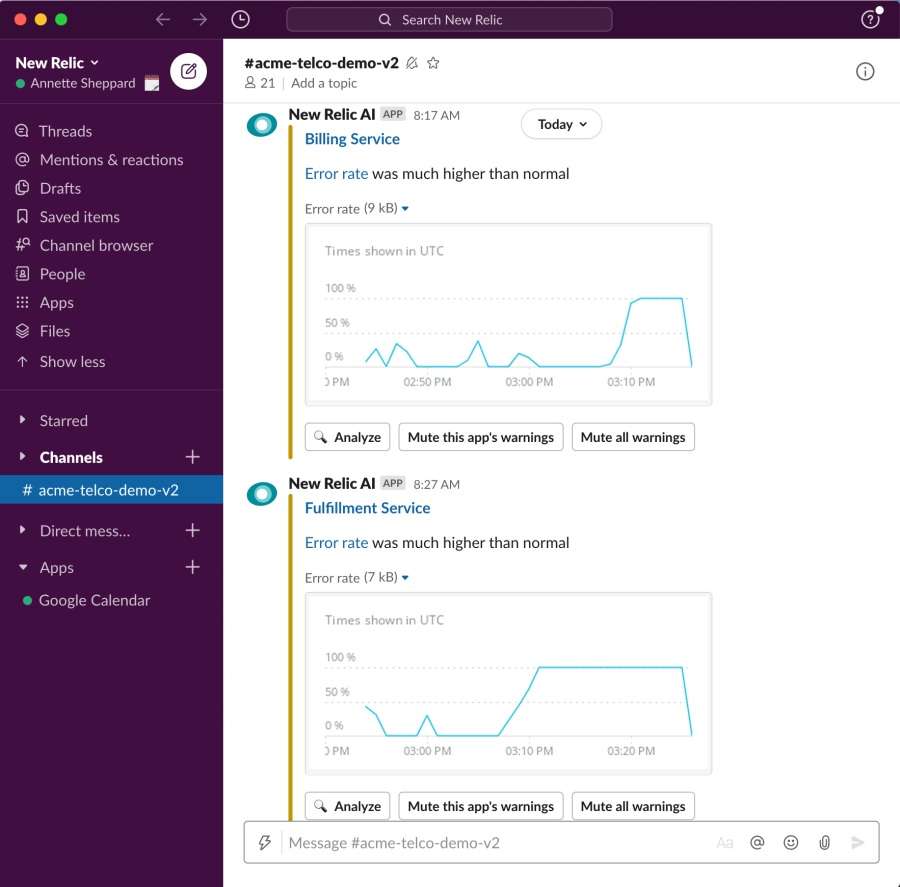
When an anomaly happens, know instantly—and get immediate insights. Real-time failure warnings detect anomalies based on key golden signals such as throughput, response time, and errors. Then when it goes back to normal, you’ll get an automatic recovery message. Send anomaly notifications directly to specific Slack channels or to your tools of choice by triggering notifications using webhooks.
Mute Notifications On-Demand
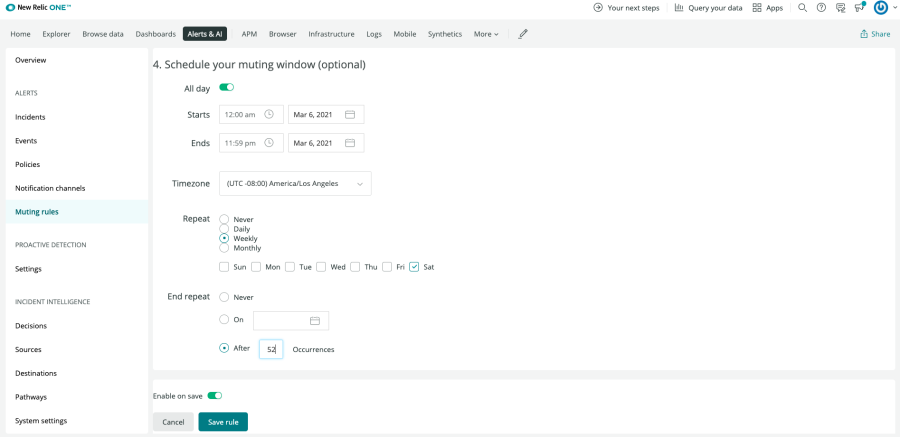
You control when and how notifications are delivered. Temporarily or permanently mute warnings for a particular application or all applications you’re monitoring in New Relic—which is especially helpful for scheduled maintenance or testing.
Alert Noise Reduction
All your Data in One Place
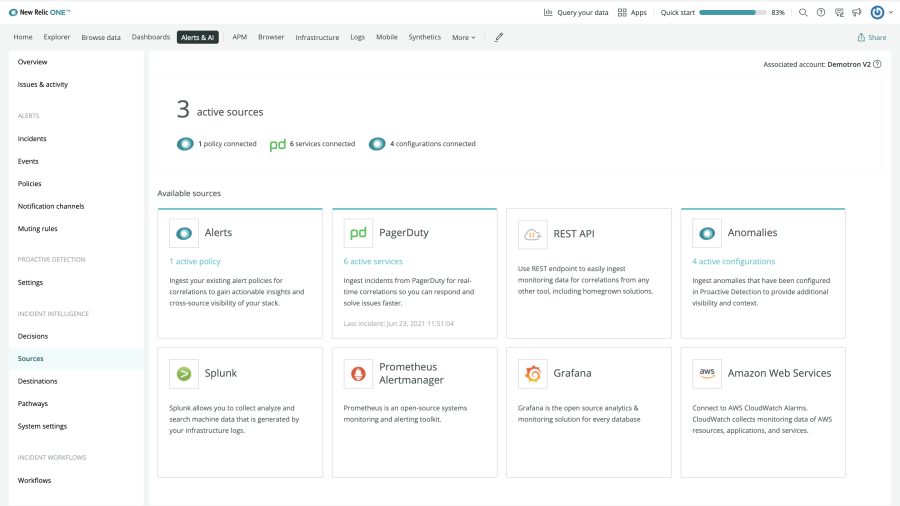
Easily connect to data from any source, including your preferred incident management and monitoring tools. Ingest alerts, incidents, and event data with minimal configuration. New Relic Applied Intelligence normalizes your data, groups related incidents, and establishes relationships between them.
Easy, Measurable Alert Noise Reduction
Set your own grace period for issue priorities to tell the system how long to wait before resurfacing an incident. Applied Intelligence evaluates if it should be correlated with other incoming incidents, if it’s flapping, or if it’s auto-resolving. You can also choose to auto-close inactive issues. You’ll also get insights into your rate of total incidents correlated, total correlated issues, noise reduction—and see the most common reasons your incidents are correlated.

Group Related Alerts into Actionable Issues
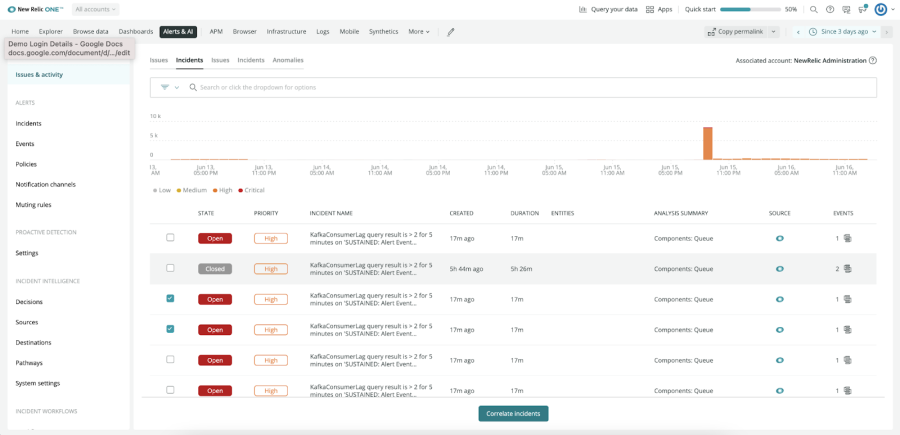
Reduce alert noise with automatic correlation of related incidents so you can see them as singular issues that are enriched with context and critical information, including automatic root cause analysis.
Correlation Decisions Tailored to Your System
Machine learning (ML) suggests relevant decisions based on your usage and historical data. You can also use the correlation assistant or intuitive decisions builder to create your own. Then preview a new decision's potential impact and effectiveness based on your own historical data, and choose what to enable.
Understand why Incidents are Correlated
Easily view the decision used for correlation and why it was used. You’ll see the rule logic that informs a correlation, such as comparing application names for similarity, for deeper insight into a problem.
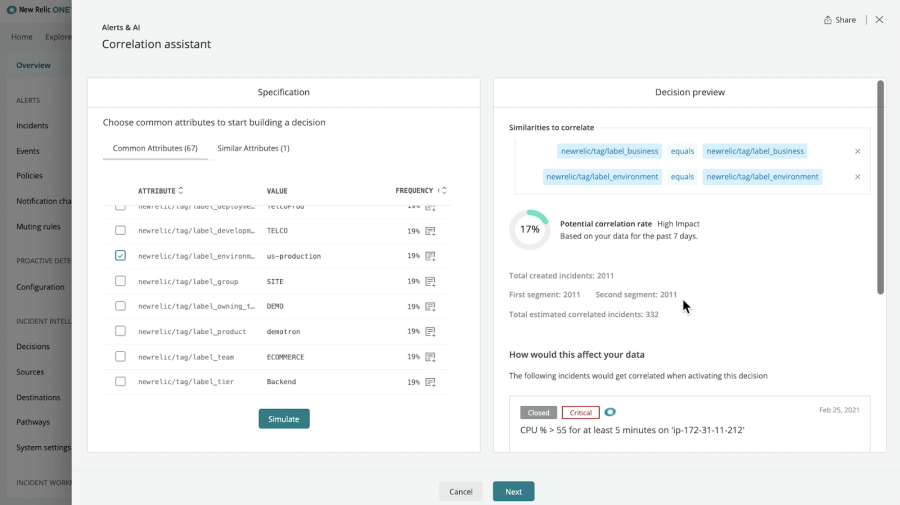
Increased Accuracy Over Time
As it builds system-specific knowledge, New Relic Applied Intelligence gets smarter over time. You can even fine tune the system in real time to help it deliver more relevant insights by providing thumbs-up or thumbs-down feedback.
Root Cause Analysis
Deep Visibility into Probable Root Causes
Orient yourself and understand a problem faster with automatic classification of issues based on golden signals like errors, traffic, latency, and saturation. You’ll see which deployments contributed to the issue, and immediately see probable root cause.

Quick Impact Assessment of Issues
When an issue occurs, you’ll Immediately see which hosts, containers, and applications are affected. An Issue map visualizes relationships so you can assess the scope of an issue and identify any neighboring entities that may be affected. Then, learn more about dependencies and dig in for more details such as recent activity, tags, metrics, transactions, and related entities so you can isolate the problem quickly to more accurately determine the scope of the problem, and fix it fast.
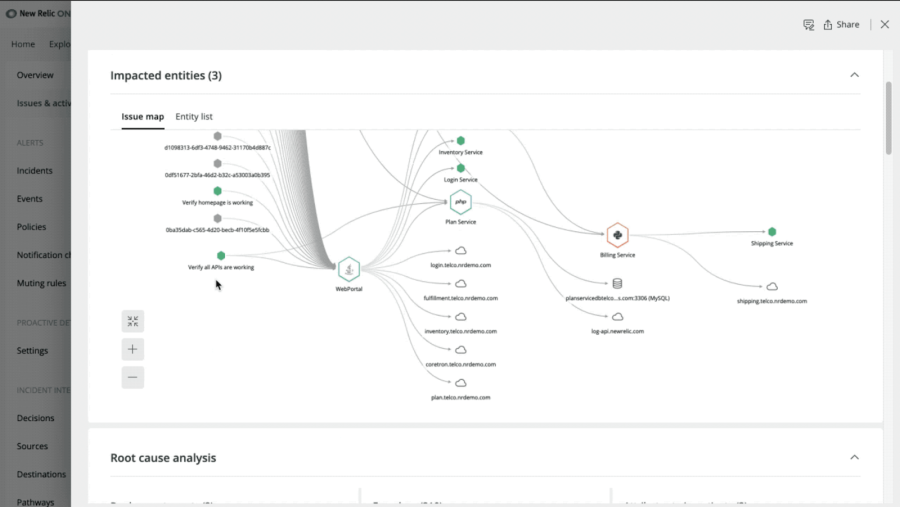
Incident Analysis at your Fingertips
Dig even deeper into the details of the incidents that create an issue. Automatic incident analysis includes datastore analysis with links to problematic queries, error analysis with links to code level stack traces, and external call signal profiling, so you can more easily investigate the problem and diagnose issues quickly.
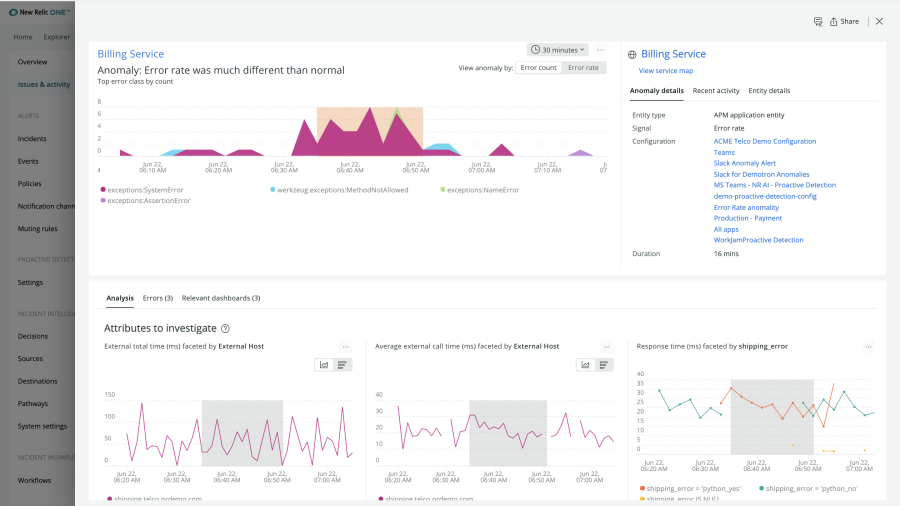
The Dashboards you Need
Applied Intelligence uses machine learning to quickly locate and surface the dashboards that are most relevant to the issue at hand.
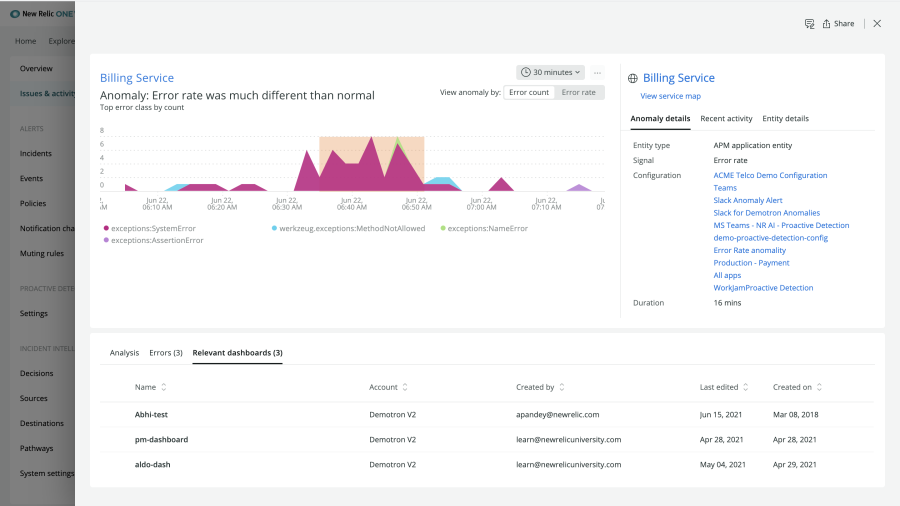
Integration with Incident Management
Easy Integration With Incident Management Tools
Now it’s easy to keep everything in sync without the toil of managing incidents across tools. With just a few clicks, New Relic Applied Intelligence integrates with incident management tools including PagerDuty, ServiceNow and more.
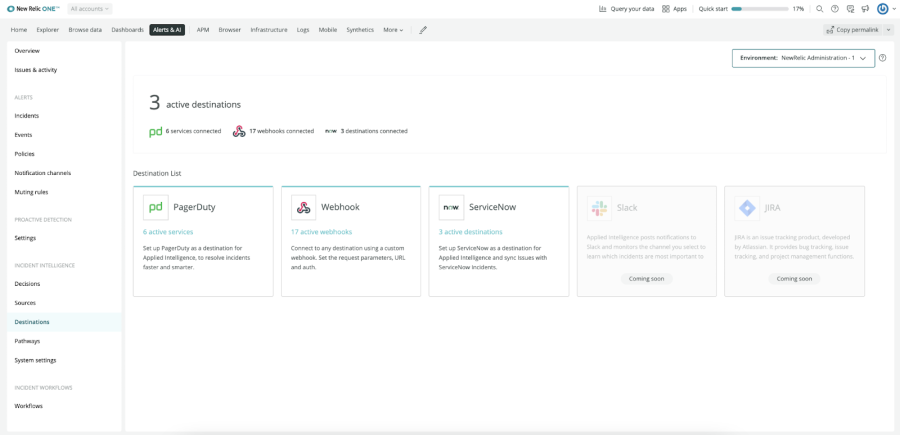
More Control of Incident Escalation
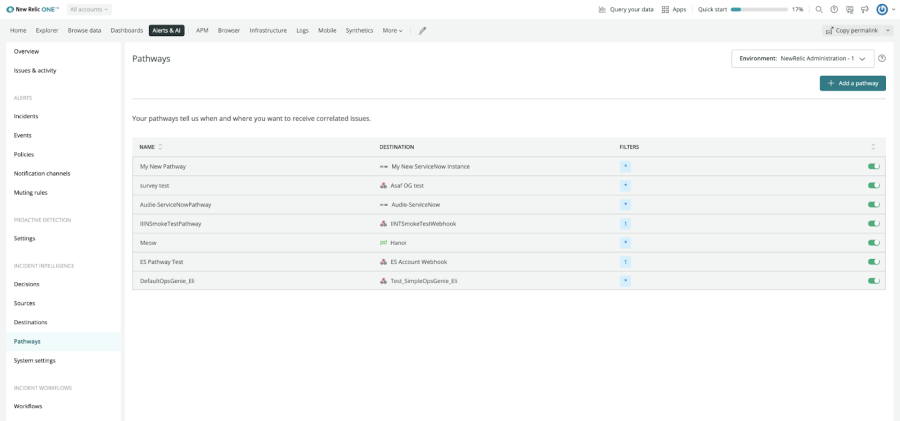
Easily choose which correlated issues are sent to where with the help of pathways. These logical routes send correlated, enriched incidents to specific destinations, like sending all incidents with a particular application name to that app team’s dedicated PagerDuty service.
