Quickstart
Comprehensive monitoring quickstart for NuxtJS
Transform your Vue.js development experience with NuxtJS monitoring - a powerful framework that revolutionizes the way you build server-rendered applications. Say goodbye to cumbersome data management, messy middleware, and frustrating routing with our effortless quickstart dashboards - empowering you to unleash your full potential with ease.
Why monitor NuxtJS?
Identify data binding errors
Incorrect data bindings or missing data bindings can cause issues with the application's behavior. Catch them before your users do.
Track quickly when a component isn’t rendering
If a component is not properly defined or missing, it won't render in the application. This can cause bugs in your application.
Get alerted about incorrect lifecycle hook orders
If the lifecycle hooks are not properly ordered, it can cause issues with the component's behavior. Get alerted to order issues quickly and efficiently.
Quickly identify network errors
Network errors, such as CORS or API errors, can cause issues in fetching and rendering data. Don’t get caught up with extra network time, with immediate alerts you won’t miss a beat.
Unlock the power of real-time monitoring with New Relic’s Nuxt.js quickstart
Stay ahead of poor user experience with our monitoring dashboard- providing instant insight into challenges and enabling a rapid resolution.
What’s included in this quickstart?
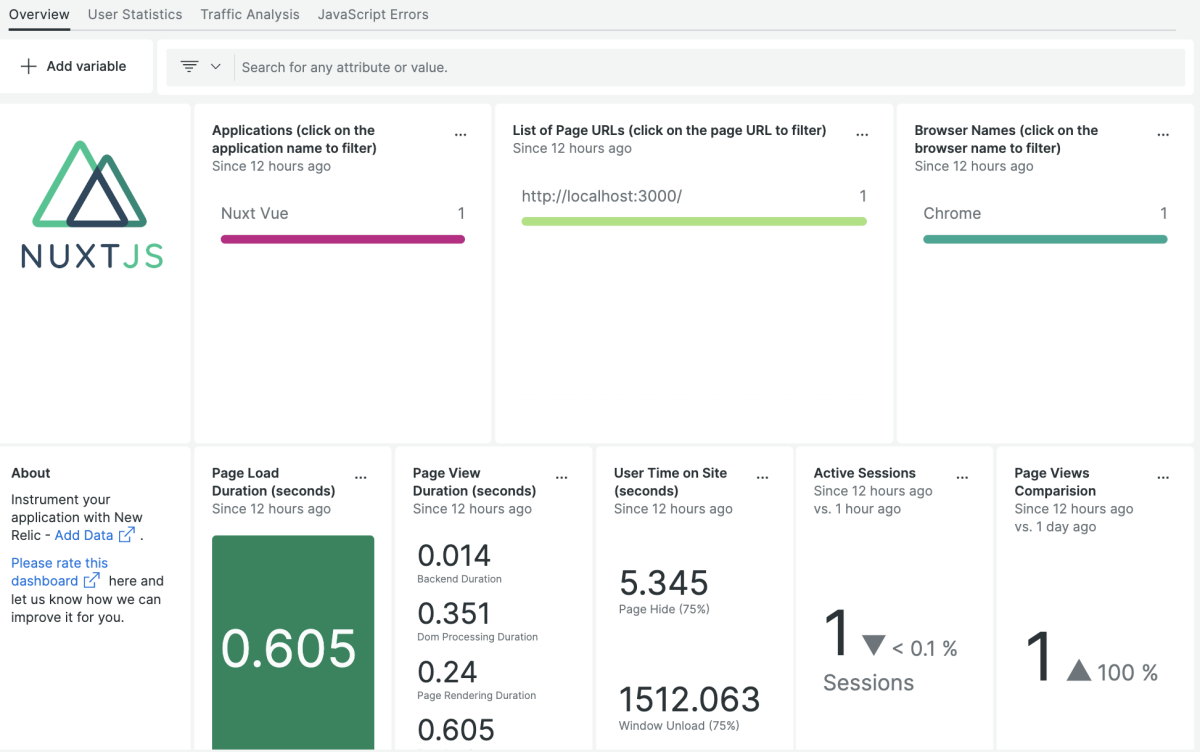
New Relic's NuxtJS monitoring quickstart boasts instant full-stack observability out-of-the-box:
- Easy to use performance monitoring dashboards.
- See all your JavaScript errors tagged by deployment.
- Get a detailed view of your web application traffic, including page views, load times, sessions, and most popular content.
Need help? Visit our Support Center or check out our community forum, the Explorers Hub.


