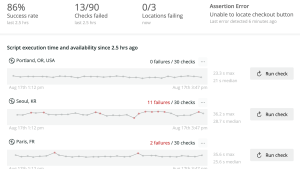
Statuspage is a status and incident communication tool from Atlassian for informing your end users when your pages are down due to outages or scheduled maintenance. By using New Relic synthetic scripts, you can leverage Statuspage to inform you when services are down, helping you find and fix issues faster.
If you’re already using an observability tool like New Relic, you might be wondering why it would be worthwhile to monitor Statuspage, too. You may have set up monitoring and alerts for many of your services already, and if so, there’s a good chance that you’re using integrations to fill monitoring gaps in your observability solution.
Yet some external services are really challenging to monitor, and it can be helpful to have additional data points on total downtime, especially if there’s any chance that you’re not able to monitor downtime with 100% accuracy. Also, Statuspage groups components together and lets you know whether a service as a whole is up or down, which can be particularly helpful if you need to quickly know whether a few downed components are affecting the overall uptime of your services.
In this blog post, you’ll learn how to use a New Relic synthetic scripted API test to get Statuspage uptime data. You can then create New Relic alerts when Statuspage says pages are down or performance is degraded, and you can also send that data to your New Relic logs.
This tutorial assumes that you have Statuspage set up already. If you don’t have a New Relic account, you can sign up for a free account to follow along.
Get Statuspage data into New Relic
1. First, you need to get Statuspage data into New Relic. To do so, log into Statuspage, select your Profile icon, and select API info to get your Organizational API keys and your Statuspage Page ID. The next image shows where you can find the API info.
2. Next, you need to create a synthetic scripted API test in New Relic. A simple synthetic test pings a page while a scripted API test periodically makes a request to an API—in this case, Statuspage.
Input the following code for your synthetic scripted API test. Note that you’ll need to include the secure credentials for your Statuspage API key and Page ID and that this code uses environment variables. The instructions for including environment variables in a synthetic script are included in the next section.
var got = require('got');

const pageId = $secure.STATUSPAGE_PAGEID;
const url = `https://api.statuspage.io/v1/pages/${pageId}/components`;

let resp = await got(url, {
  headers: {
    'Authorization': 'OAuth ' + $secure.STATUSPAGE_API_KEY
  }
});

if (resp.statusCode == 200) {
  let data = JSON.parse(resp.body);
  //console.log(data);

  got.post('https://log-api.newrelic.com/log/v1', {
      headers: {
        'Api-Key': $secure.INGEST_KEY,
        'Content-Type': 'application/json'
      },
      json: data
    });
}
else {
  console.log(resp.body);
  return 'failed';
};
This code makes a request to the Statuspage component endpoint to get the status of each component group and its components. Since the data is already JSON-formatted, we send this back to New Relic Log API and the fields are automatically parsed to use as attributes in New Relic.
Create secure credentials for synthetic tests
1. To create secure credentials as shown in the previous code snippet, select Synthetic Monitoring from the left-hand menu, then Secure credentials, and then + Create secure credential.
2. Enter a key name, value, and description so you remember what the secure credential is for. You’ll need keys for STATUSPAGE_PAGEID, STATUSPAGE_API_KEY, and INGEST_KEY.
Validate and save your synthetic test
Select the Validate button to make sure the script works, then select the Save monitor button. As the next screenshot shows, both of these buttons are below the script.
Note that Statuspage has some API limits, so running this once per minute should be enough to get the data you need without exceeding Statuspage limits.
Important: You’ll also need to be aware of the number of synthetic tests you can make with your New Relic account, as additional tests beyond your account limit come with a small cost ($.005/test) that adds up over time. Here are the limits:
- Free: 500 free tests/month
- Standard: 10K free tests/month
- Pro: 1M free tests/month
- Enterprise: 10M free tests/month
With free and standard accounts, you’ll need to do fewer requests to the Statuspage API, so plan accordingly. Select Synthetics on the pricing page to learn more.
Visualize Statuspage data in New Relic
Now let’s take a look at how you can visualize the data in New Relic, and how it compares to the visualization in Statuspage.
Here's an example of what component groups look like on Statuspage along with their current status:
1. To visualize this data in New Relic, select All Capabilities from the left-hand menu in New Relic and then select Query Your Data.

2. To see the component name and the status of each component, run this query. (Note that group=true has no quotes.)
SELECT latest(status) FROM Log WHERE group=true FACET name3. Review the data, which you can save as a dashboard in New Relic. You’ll see that it provides both the component name and the status of each component, just like Statuspage.
4. Now let's look at component groups. Here's what components look like under each component group on Statuspage:
You can use this query in New Relic to see the same data. (Note that group=false does not have quotes.)
SELECT latest(status) FROM Log WHERE group=false FACET nameHere's the dashboard of Statuspage components in New Relic:
5. Now that you have dashboards based on the status of your pages, the next step is to create alerts that trigger when pages are no longer operational. These are the statuses that Statuspage uses that are most useful for alerting.
- operational
- degraded performance
- partial outage
- major outage
- under maintenance
For example, you might want to trigger alerts for any status other than operational, or you might want to create one specifically for major outages. If you haven’t created an alert in New Relic and would like to create one now, see Create your first alert.
6. The previous dashboard shows you the current status of your Statuspage components. What if you want to instead want a dashboard that reflects the total uptime of your components as a percentage? Here’s a query for that:
SELECT percentage(count(*), WHERE status='operational') as 'Uptime'
FROM Log WHERE page_id ='xxxxxxxxxxxx' AND group=true FACET name LIMIT MAX
And here's the dashboard itself:
We can always hope for 100% uptime!
Conclusion
In this post, you learned how to use a scripted API test to send Statuspage updates to your New Relic logs. From there, you can query your logs to create dashboards and alerts that help you better understand the uptime of your services.
次のステップ
You can get started with synthetic monitoring in just a few minutes with a free New Relic account. Your account includes 100 GB/month of free data ingest, one free full-access user, and unlimited free basic users.
To learn more about synthetic monitoring, see Get started with synthetic monitoring.
本ブログに掲載されている見解は著者に所属するものであり、必ずしも New Relic 株式会社の公式見解であるわけではありません。また、本ブログには、外部サイトにアクセスするリンクが含まれる場合があります。それらリンク先の内容について、New Relic がいかなる保証も提供することはありません。


