New Relicを使用してAzureにオブザーバビリティを実装する方法に焦点を当てた、新しいシリーズの第1弾にようこそ。この取り組みを始めるにあたっては、Azureで収集すべきデータとその重要性に焦点を当て、その後、将来のイテレーションでより高度な計装へと進みます。この入門記事では、次のような基本的な要素について説明します。
- Azureの概念:用語と構造について
- データキャプチャの基本:収集できるテレメトリーデータの特定
- New Relicとの統合:この情報をNew Relicに取り込む方法
しかし、詳細に入る前に、いくつかの質問に答えてみましょう。
Azure環境にオブザーバビリティを実装することが重要な理由
Azureは、企業向けソリューションの構築に使用できる200を超えるさまざまなサービスを提供する、優れたプラットフォームです。しかし、システム停止は収益に直接影響を及ぼし、社内チームに負担をかける可能性があるため、速やかに検出して解決することが重要になります。
このブログの対象読者
この投稿は、元Microsoftソリューションアーキテクトの視点から、AzureアカウントでNew Relicを正常にセットアップする方法に関するガイダンス、指示、またはヒントを求めている方を対象としています。
Azureのメリットのほかに、New Relicが提供するメリット
New Relicは、Azureで利用可能な情報を基にして、次の方法で機能強化します。
- 自動化された関係の検出とマッピング:New Relicは、インフラストラクチャメトリクス、ログ、データベースクエリなどをアプリケーションに自動的にマッピングします。データを理解し、どこを調べるべきかを把握するためのエンジニアリングの労力と認知負荷が軽減されます。
- キュレートされたビュー:お客様にとって何が重要であるか(オブザーバビリティのリーダーとして)に関する独自の視点を活用しながら、特定のエンティティに焦点を当てます。
- エンドツーエンドの可視性:デジタル資産全体に関する包括的なインサイトを取得します。ユーザーがUI上のボタンをクリックするところから、データベースでクエリが実行されるところまで、あらゆる情報を把握できます。
- テクノロジーとビジネスプロセスをマッピング:サイロを解消し、サポート対象のビジネスプロセスのコンテキストでテクノロジーを視覚化します。
Azureの概念
Azureのガバナンス構造は、すべてのサブスクリプションがリンクされる基盤として機能するテナントルートを中心に構成されています。仮想マシン(VM)などのすべてのクラウドリソースは、サブスクリプションに導入されます。
ガバナンスのために、Microsoftは管理グループを設定することを推奨しています。これは基本的に、サブスクリプションをグループ化し、ロールベースのアクセス制御(RBAC)とポリシー(クラウド使用のガードレール)を適用できるフォルダーです。
これを視覚的に理解しやすくするために、Azureのガバナンス構造をAWSと並べて示す図を以下に示します。この比較が、既にAWSをご利用いただいている読者の皆様のお役に立てれば幸いです。
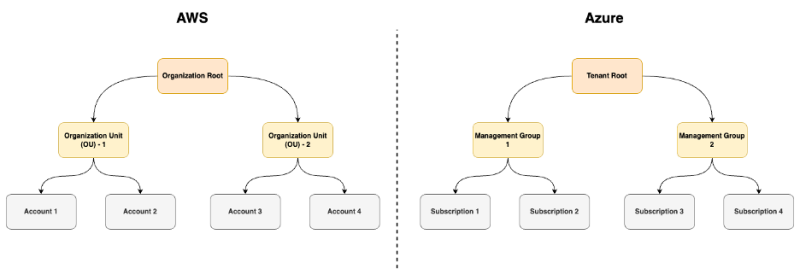
また、AWSとAzureで使用されるさまざまな用語の簡単な比較を以下に示します。
AWS | Azure | 目的 |
アカウント | サブスクリプション | クラウドリソースがデプロイされる場所 |
組織 | 管理グループ | アカウントを大規模に管理(コントロール/グループ化を使用)し、ネストすることも可能 |
CloudWatchメトリクス | Azure Monitor - メトリクス | リソースメトリクスを収集、保存、クエリするための組み込みソリューション |
CloudWatch - ログ | Log analytics | リソースログを収集、保存、クエリするための組み込みソリューション |
X-Ray | アプリケーションインサイト | アプリケーションパフォーマンス監視(APM) |
クラウドトレイル | アクティビティログ | 監査イベントをクラウドにキャプチャ・保存 |
CloudWatchログ | 診断設定 | リソースログを有効にする |
便利な参照表ができたので、Azureで実際に利用できるデータは何か、疑問に思うかもしれません。
これは、スコープ(レベル)と導入されているAzureリソースによって異なります。リソースごとに、利用できるテレメトリーオプションが異なります。
ヒント:
- クラウドリソースをリージョンごとに分割するAWSマネジメントコンソールとは異なり、Azure UIにはグローバルビューがあります。UIには、フィルタリング可能な地域の列が表示されます。
スコープ
怠けるつもりはありませんが、Microsoftドキュメントの公式定義は次のとおりです。
「Azureでは、管理グループ、サブスクリプション、リソースグループ、リソースの4つのレベルでスコープを指定できます。スコープは親子関係で構造化されており、階層構造が進むにつれてスコープはより具体的になります。」
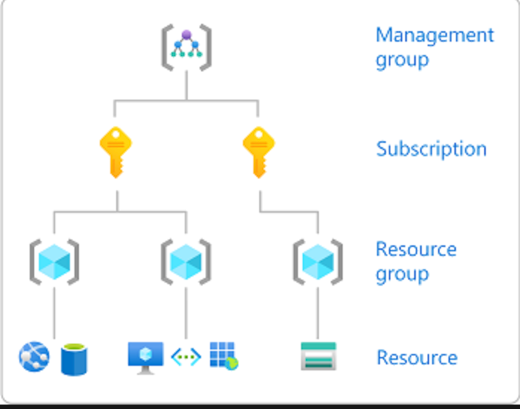
オブザーバビリティを目的として、次の点に焦点を当てます。
- サブスクリプション:リソースがデプロイされる場所
- リソース:使用されるクラウドサービス(VM、サーバーレス機能、データベースなど)
- アプリケーション:Azure リソース(2)上で実行されているアプリケーション(コード)。これは公式のAzureスコープではありませんが、オブザーバビリティの観点からは重要です。
アカウント構造を視覚化した最初の図を基に、サブスクリプション、リソース、アプリケーションという3つのスコープについて詳しく見ていきましょう。
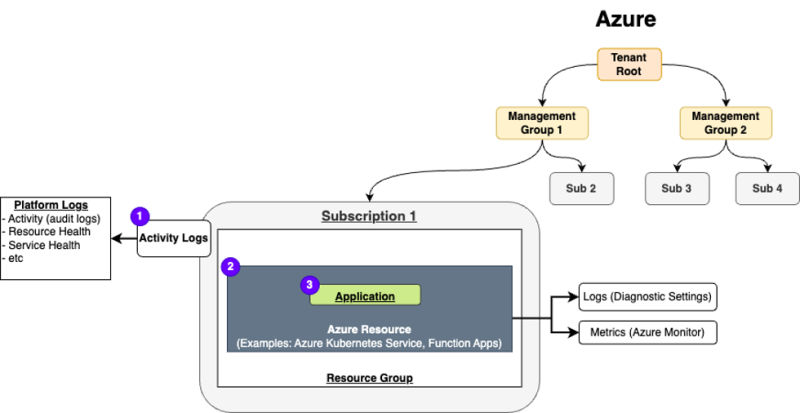
1 - サブスクリプション
Azureサブスクリプションのアクティビティログは、サブスクリプションレベルのイベントに関するインサイトを提供するプラットフォームログです。これらのログには、リソースが作成、変更、削除された日時、およびAzureサービスのシステム停止などの情報が含まれています。サブスクリプションの設定を表示するには、Azure Portalでサブスクリプションを参照し、左側の [Activity log] タブをクリックして、[Export Activity Logs]をクリックします。
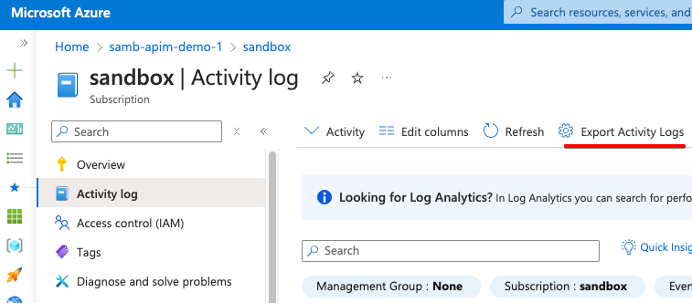
これにより、サブスクリプションの診断設定が表示されます。
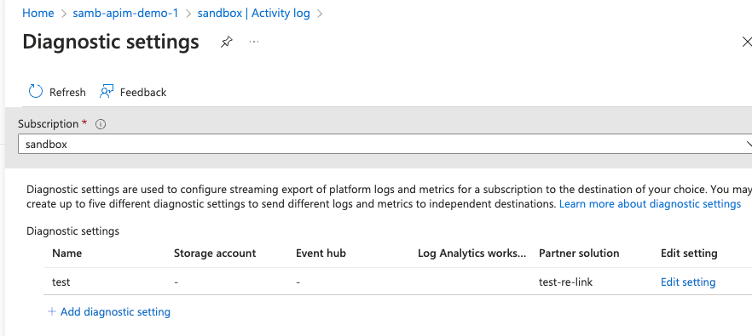
サブスクリプションは、8つの異なるログカテゴリのエクスポートをサポートします。
- 管理:作成、更新、削除アクションなど、リソースに対して実行された管理操作をキャプチャします。
- セキュリティ:権限やアクセス試行などのセキュリティイベントや変更に関連するログ。
- ServiceHealth:Azureサービスの正常性と、サービスの可用性に影響を与える注目すべきイベントに関する情報を提供します。
- アラート:操作と状態を通知するアラートルールとイベントに関する情報が含まれます。
- レコメンデーション:Azureリソースのコスト、セキュリティ、パフォーマンス、信頼性を向上させるためのAzure Advisorからの提案が含まれます。
- ポリシー:Azureポリシーの割り当てに関連するコンプライアンス状態の変更とアクティビティを追跡します。
- 自動スケール:パフォーマンス基準を満たすためにインスタンスの数を変更する自動スケールイベントとアクションをログに記録します。
- ResourceHealth:Azureリソースの稼働ステータスを報告し、その操作に影響する進行中の問題を特定します。
Azure Monitorの診断設定の詳細については、こちらをクリックしてください。
ヒント:
- すべてのログカテゴリを公開する必要がありますか?いいえ。
- 何を公開すべきでしょうか?まず、Administrative、ServiceHealth、Alert、Autoscale、ResourceHealthのログを収集します。次に、個々の要件に基づいて、オプションで他のログを含めます。
- これを大規模に(複数のサブスクリプションにわたって)有効にする場合:
- 環境がクラウド導入フレームワーク(CAF)パターンに従っている場合は、ログ分析ワークスペースではなく、EventHub(New Relicのインテグレーション)を指すようにポリシーを変更できます。
- それ以外の場合は、コードとしてのインフラストラクチャ(IaC、例:TerraformやBicep)、またはサブスクリプション販売プロセスを使用します。
2 - リソース
サブスクリプションレベルでアクティビティログをキャプチャするのは、ほんの始まりにすぎません。この基本的なステップが完了したら、導入されているAzureリソースに注目できるようになります。このスコープでキャプチャする必要があるものは2つあります。
ログ(Azure - 診断設定):
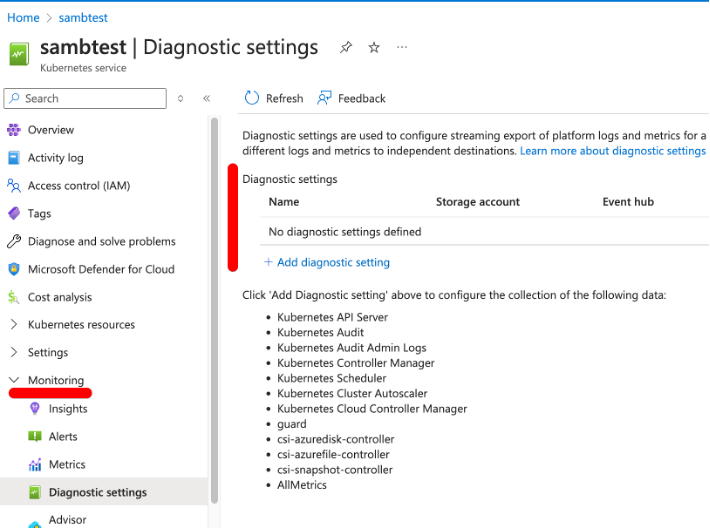
上の図では、AzureリソースとしてAzure Kubernetes Service(AKS)のボックスが表示されています。AKSには構成可能な診断設定があるためこれを選択しましたが、すべてのAzureサービスが診断設定をサポートしているわけではないことを知っておくことが重要です。したがって、Azureサービスをプロビジョニングするときは、利用可能なログを確認することが重要です。
Q:Azureメトリクスとサブスクリプションレベルの診断セットアップがある場合、リソースレベルの診断が必要なのはなぜですか?
A:リソースレベルの診断はリソースに固有です。たとえば、Azure Container Appsには、replicaCountやrestartsといった便利なメトリクスがあります。しかし、なぜコンテナが再起動したのでしょうか?正常性チェックに失敗しましたか、メモリ不足(OOM)による再起動ですか?マネージドサービスでこのレベルの詳細度を実現するには、診断を有効にする必要があります。
Azureリソース診断が設定されているかどうかを確認するには、特定のリソースの[Monitoring]タブを開きます。
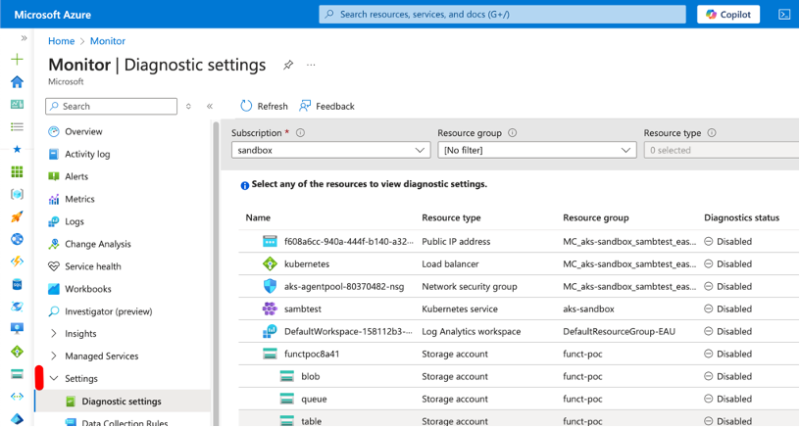
または、Azure Monitorを開いて、[Settings]タブを展開します。
メトリクス
Azureは、すべてのクラウドリソースのメトリクスを90日間提供します。利用可能なメトリクスは、使用されているAzureサービス(VMのCPU使用率やキューサービス内のメッセージなど)によって異なります。これらのメトリクスは、New Relicポータルで設定されたAzureインテグレーション、またはNew Relic Azure Marketplaceインテグレーションを使用して、New Relicに簡単に取り込むことができます。これらの違いについては、以下で詳しく説明します。
基本的には以下のようになります。
- 既存のNew Relicアカウントをお持ちの場合は、Azureインテグレーションを使用する方が簡単です。
- 初めてNew Relicを設定し、Azure経由で課金される(Microsoft年間消費コミットメント(MACC)を使用)ことを希望する場合は、Azure Marketplaceのインテグレーションを評価することをお勧めします。
ヒント:
- すべてを有効にするのではなく、各ログカテゴリの目的を理解してください。Azureには、ログが非常に詳細であったり、互いに重複しているインスタンスがいくつかあります( AKS Kubernetes監査ログやKubernetes管理監査ログなど)。
- いくつかのAzureサービスには、診断設定にメトリクスカテゴリがあります。すでにNew Relicでメトリクスポーリングを有効にしている場合は、データが2倍になる可能性があります。
- New Relicはディメンションメトリクスを13か月間保持します。
3 - アプリケーション
データのキャプチャに重点を置く必要がある最後の領域は、Azureで実行されている実際のアプリケーションです。クラウドで実行されているアプリケーションを計装する方法はたくさんあります。しかし、要約すると次のようになります。
- 拡張機能/プラグインを使用する:Azureでは、アプリサービス(Elastic Beanstalkに類似)、関数アプリ(Lamba関数など)、ロジックアプリ、仮想マシンスケールセット(EC2 AutoScalingグループ)などの各種サービス用の拡張機能が提供されています。これを設定するには、クラウドリソースで拡張機能を有効にし、いくつかの変数(New Relicライセンスキーやその他のメタデータなど)を設定するだけです。
- 事前インストールする:たとえば、New RelicエージェントをDockerfile(コンテナマニフェスト)に含めてコンテナイメージを導入する(New Relicが事前インストールされた状態)か、New Relic InfrastructureエージェントをVMイメージに事前インストールすることが挙げられます。これは、インフラストラクチャ層を制御できないコンテナインスタンスやLinux FunctionsなどのAzureサービスに役立ちます。
- 自動インストゥルメンテーション:New Relicは、Kubernetesの自動インストゥルメンテーション機能を提供します。ポッドが作成されると、APMエージェントが自動的に挿入され、テレメトリーのキャプチャが開始されます。
事前インストールや自動計装のオプションもありますが、アプリケーションを完全に制御して最大限に活用するには、アプリケーションレベルで計装する必要があります。これを行うと、次のことが可能になります。
- カスタムメトリックを公開すると、インサイトが得られたり、パフォーマンスやトラブルシューティングが簡素化されることがあります。
- コンテキスト内のログを使用して、アプリケーションログをNew Relic UIのさまざまなページ内のAPMポータルにマッピングします。
- キャプチャトレースは、トランザクションの詳細な内訳、リアルタイムのグラフィカルな依存関係マップ、特定されたエラーの視覚化を提供します。
Azureメトリクスや診断設定がある場合でも、このデータはアプリケーションの完全なビューを作成するために重要であるため、引き続き必要です。
診断設定
診断設定については説明してきましたが、設定オプションについてはまだ触れていません。診断設定には、公開できる4つの宛先オプション(1つ以上)が用意されています。
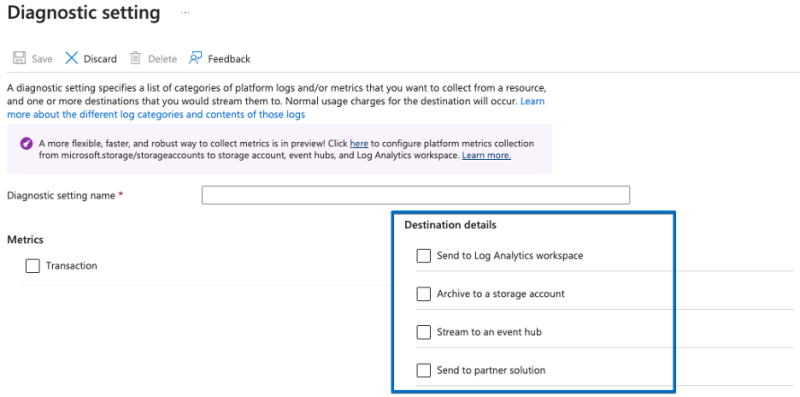
- ログ分析ワークスペース:ログのクエリ、アラートの発行、ダッシュボードへの追加が可能なMicrosoftのログソリューション。
- ストレージアカウント:長期アーカイブやコンプライアンスのためのログの保存に最適です。これはAzure Blobストレージサービス(AzureのS3バケットに相当)です。
- EventHub:これは、高スループットのデータストリーミング用に設計されたクラウドベースのサービスで、最小限の遅延で1秒あたり数百万のイベントを処理できます。AWS Kinesis FirehoseやKafka Topicへのデータ公開と同じコンセプトです。New Relicは、このオプションをログフォワーダーソリューションの一部として活用します(詳細は下記を参照)。
- パートナーソリューション:一例として、New Relic Azure Marketplaceオファリングが挙げられます。
ヒント:
- Microsoftは、今後数年間で診断設定からデータ収集ルールへと移行する予定です。
- Azureログ転送ソリューションを導入するときに、パブリックネットワークを拒否するAzureポリシーがある場合は、Azureログフォワーダーの導入に使用されるIaCテンプレートで使用可能なプライベートネットワークパラメーターを使用する必要があります。
このデータをNew Relicに取り込むにはどうすればよいですか?
以下は、メトリクスと診断設定(ログ)をNew Relicに公開する方法の一覧です。アプリケーションレベルのテレメトリーデータを収集するためのガイダンスは含まれていません。この点については上記で簡単に触れましたが、次回のブログ記事で取り上げます。
オプション1:New Relic Azureインテグレーション(メトリクス)
New Relicには、Azureからメトリクスを取得するAzureインテグレーションがあります。これを設定する際は、インテグレーションを設定するときに表示される従来のオプションに注意する必要があります。複雑さを軽減するために、「Azure Monitorメトリクス」という新しいオプションを導入しました。このアプローチにより、顧客はAzure Monitor APIから直接収集されるメトリクスを選択できます。
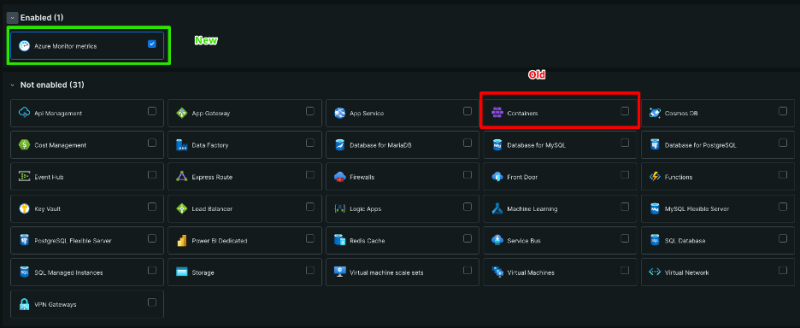
Azure Monitorオプションには次の機能もあります。
- ポーリング頻度の改善により、表示時間が短縮される
- 追加のメタデータマッピング(クラウドタグなど)
- Azureで利用可能な最新のメトリクス
- メトリクスを含むすべてのAzureリソースのサポート
ヒント:
- Azure Monitorメトリクスインテグレーションを使用します。
- 複数のサブスクリプションのインテグレーションを設定するときは、単一の Azureサービスプリンシパルを使用しないでください。サブスクリプションのサイズに応じて、サブスクリプションごとに1つを推奨します。理由:Azureでは、サービスプリンシパルごとにAPIポーリング制限があります。
- サービスプリンシパルのクライアントシークレットの有効期限が切れる時期については、常にリマインダーを設定します。
- Azure Monitorインテグレーションと従来のオプションを使用すると、重複したメトリクスがキャプチャされる可能性があるため、注意してください。
- Azureのタグを使用して、New Relicに取り込まれるメトリクスを除外することを検討してください(これが考慮事項である場合)。この例としては、リソースにNewrelic: trueのタグを付けて、このタグが付いたすべてのクラウドリソースのメトリクスを収集することが挙げられます。
New RelicとAzure Monitorのインテグレーションの詳細については、New Relicのドキュメントをご覧ください。
オプション2:Azureログフォワーダー(ログ)
Amazon Data Kinesis Firehoseを活用してNew Relicエンドポイントにデータを公開するAWSメトリクスストリームソリューションと同様に、New RelicはAzureリソースをプロビジョニングして、送信されたログをNew Relicに公開できるコードとしてのインフラストラクチャテンプレートを提供します。
各Azure診断設定は、プロビジョニングされたイベントハブインスタンスを指すことができます。ログが公開されると、Azure Functionsがトリガーされ、ログがNew Relic APIに公開されます。
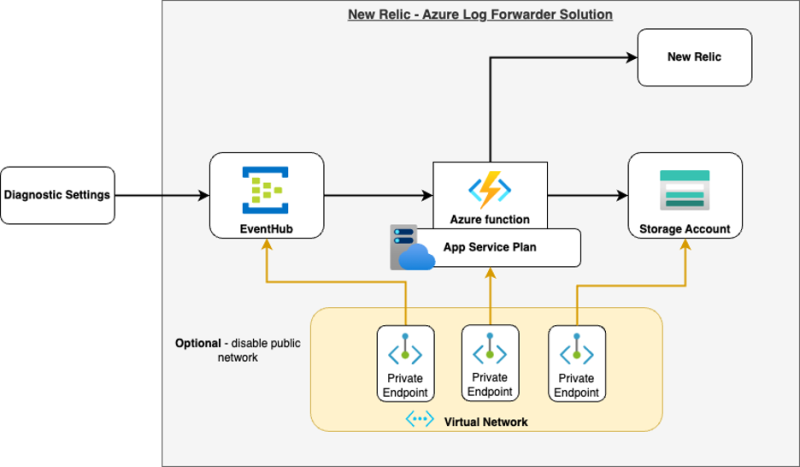
コードはGitHubで入手できます。New Relicの公式ドキュメントはこちらからご覧いただけます。
ヒント:
- New Relicは、取り込み前にログを削除するドロップルールと、機密データが取り込まれないようにマスクするルールをサポートしています。
- 企業組織では、Azureポリシーを使用してリソースの導入方法を制御します。その結果、コードとしてのインフラストラクチャテンプレートのデフォルトパラメーターが機能しない可能性があります。プライベートネットワークのオプションがあります。またはこのインテグレーションに対してポリシーの例外を設定することもできます(例:Scope=ResourceGroup)。
オプション3:Azureネイティブインテグレーション - Marketplace(ログとメトリクス)
Azure Native New Relicサービスは、Azure Marketplaceを通じてプロビジョニングできます。これにより、顧客はAzureメトリクス、サブスクリプションログ、リソース診断ログを自動的に収集できるようになります。また、VMへのNew Relicエージェントのインストールとアンインストールも、分かりやすく操作できます。
Marketplaceからインテグレーションがインストールされると、監視対象リソースのリストが生成されます。
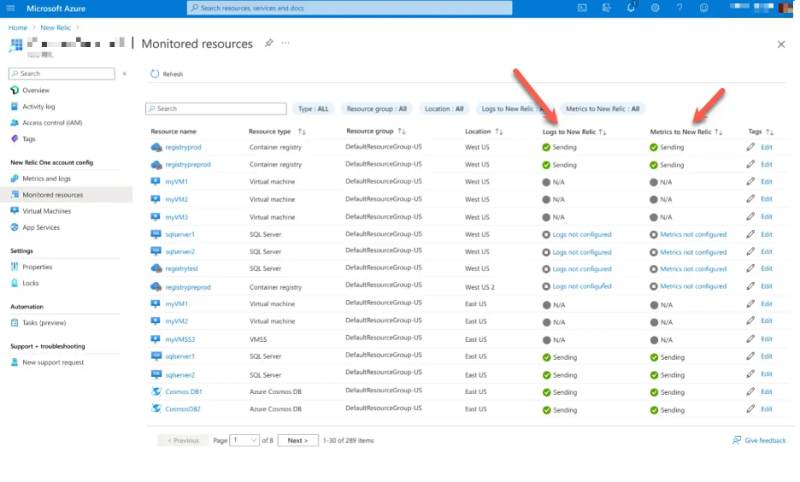
メトリクス列には、Azure Monitorからのメトリクスのコレクションが表示されます。これらは、New RelicポータルからAzure Monitorインテグレーションを使用して取り込むことができるメトリクスと同じです。
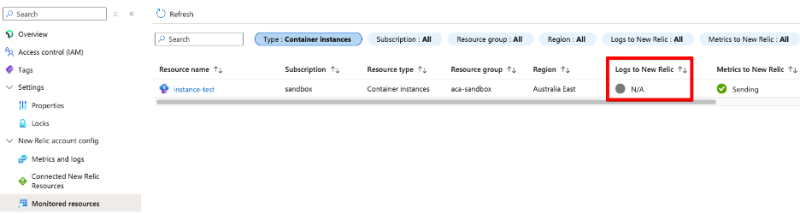
ただし、ログ列についてはさらに詳しく調べる必要があります。[Logs to New Relic]列には、Azure診断設定がNew Relicパートナーソリューションにデータをエクスポートするように設定されているかどうかが示されます。ただし、このオプションはすべてのAzureサービスで使用できるわけではありません。
まとめ
既存のNew Relicアカウントがあり、既存の課金体系を維持したい場合は、次の手順を実行します。
- ログを取得する:Azureログフォワーダーを設定し、サービスの診断設定を公開します。New Relicログフォワーダーを使用します。
- メトリクスを取得する:Azureインテグレーションを使用します。
あるいは、新規顧客やAzure支出からの取引を希望する顧客の場合は、ログ記録とNew Relic Azure Marketplaceインテグレーションの監視にNew Relic Azure Marketplaceインテグレーションを活用します。
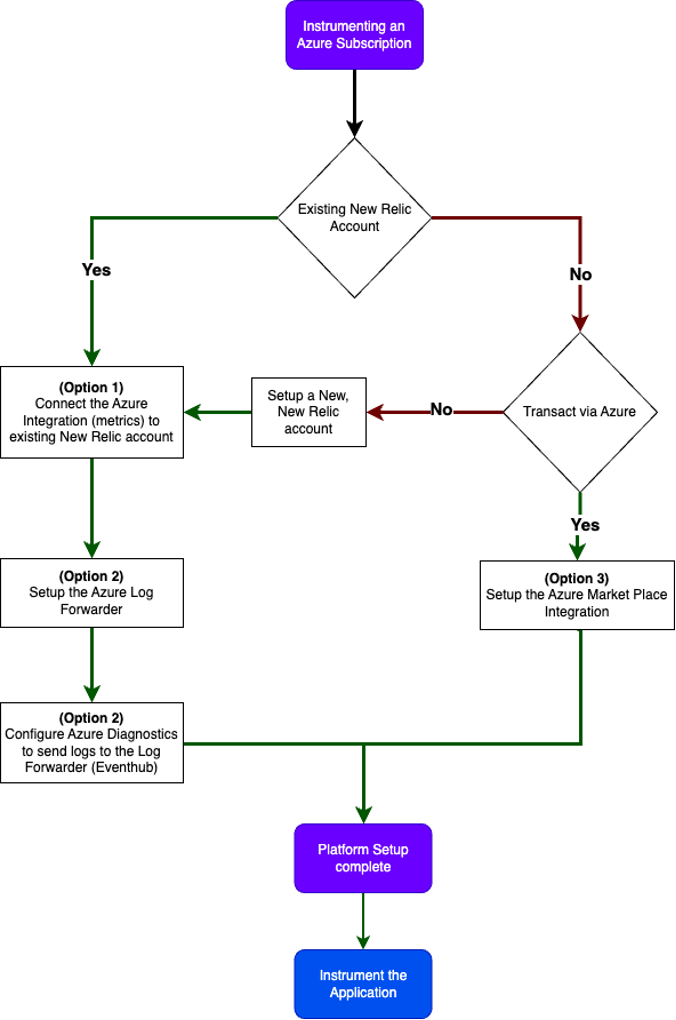
プラットフォームのセットアップが完了すると、顧客はNew Relic APM、インフラストラクチャ、またはbrowserを使用して、Azureで実行されているアプリケーションまたはコードを計装することに集中できます。詳細については、計装ガイドを参照してください。
シリーズの次回
基盤は、堅牢でスケーラブルなクラウド管理の土台となるものであり、効率的な監視と分析に不可欠です。
次回は、基礎知識を基に、さまざまなAzureサービスにNew Relicを実装する方法について詳しく説明します。乞うご期待ください!
その他のリソース:

本ブログに掲載されている見解は著者に所属するものであり、必ずしも New Relic 株式会社の公式見解であるわけではありません。また、本ブログには、外部サイトにアクセスするリンクが含まれる場合があります。それらリンク先の内容について、New Relic がいかなる保証も提供することはありません。


