We spoke to Hai Tong from Prospecta Software about the role of observability in master data management, and the importance of shifting from reactive to proactive monitoring for enabling the best customer experiences.
Can you share some background on Prospecta and how you’re making master data management easy for your customers?
Master data management in large and complex industries such as mining, rail, fast-moving consumer goods, health, and telecommunications can be challenging. These industries require customized systems to meet tailored needs, and must meet requirements that govern the creation of master data processes.
The Prospecta platform is designed to support master data management for these industries. With teams across the globe, we currently operate in North and South America, Europe, and the Asia Pacific region, with plans for further expansion in the coming years. As an endorsed SAP partner in the master data governance space, we ensure high standards and compliance.
Managing this data flow is complex and demands rigorous quality checks and authorizations for each piece of data created within the system. This is where New Relic becomes invaluable. We handle data sets that could have over a hundred different rules, each with its own matrix of complexities and conditions. New Relic provides the visibility we need to manage these intricate processes to help us detect where bottlenecks occur in both performance and error capturing.
Recently, we have collaborated with New Relic architects to identify tenant execution patterns and monitor CPU and RAM usage for each tenant. As we have continued to develop our features, we have realized that we are only just beginning to explore the full potential of what we can achieve with New Relic to further enhance the reliability and performance of our platform.
What kinds of New Relic products are you using?
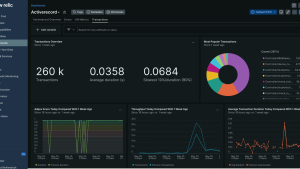
We are utilizing both APM and monitoring, with a key focus on monitoring due to the large volumes of data processed through our system. Understanding this data from different perspectives, such as individual microservice performance and overall transaction performance, is crucial. Each transaction involves multiple steps and data processing points, adding layers of complexity.
Error management is another critical aspect of our use of New Relic, as we interact with numerous microservices. Monitoring error rates and pinpointing where issues occur is increasingly vital for maintaining performance. When problems arise with a piece of master data or a transaction, it is essential to identify the exact location of the issue and address them proactively.
How does New Relic fit into your technology roadmap?
My role at Prospecta is Head of Application Development, where I oversee the development and QA teams. Both teams utilize New Relic for performance metrics, error tracking, and debugging.
A key priority in our broader technology roadmap is to identify and accurately measure the stability of our releases. We aim to measure system stability and API performance directly at the issue capture level from New Relic. For instance, when we want to assess how a specific new development enhances our platform's reliability, using New Relic provides us with a more effective means of capturing regression and issue resolution.
To adopt a more proactive approach, particularly those impacting servers and causing performance bottlenecks, we have conducted extensive performance analysis on our systems. Scaling analysis has been crucial to us and will continue to be so. By fine-tuning our pods for memory, sizing and instances, we have observed an overall improvement of 30-50% to processing speed. This is particularly true for transactions that involve complex or large numbers of governance rules.
What does the rest of your tech stack look like?
In terms of IDE, we primarily use Eclipse for its Java support, along with VS Code. New Relic APM integrates seamlessly into these IDEs to assist with debugging. For our automation builds, we rely heavily on Jenkins CI/CD, and we use Sonatype Nexus for repository management.
Our automation is driven by Selenium, and I'm keen to explore how Selenium and our test cases can integrate with New Relic to compare baseline tests and performance with real-life scenarios. Additionally, we use Argo CD for continuous deployment from our Sonatype Repository, and our infrastructure is managed via OpenShift, allowing deployment to multiple hyperscalers.
What impact has a more proactive approach to monitoring had on your business?
During the development of our Master Data Online platform, we recognised that monitoring is of critical importance to our success. We selected New Relic due to its robust capabilities, extensive support for our application tech stack, and its distributed tracing features. This allowed us to proactively troubleshoot errors in our system, and diagnose performance bottlenecks, particularly in a multi-tenant environment.
We have collaborated with New Relic to further enhance our monitoring capabilities by implementing agent weaving, which enables tracing transactions across our entire tech stack. This comprehensive view allows us to understand the behavior of complete transactions, rather than just isolated executions on specific microservices. We have been able to make our platform more robust and have improved customer satisfaction as a result.
次のステップ
本ブログに掲載されている見解は著者に所属するものであり、必ずしも New Relic 株式会社の公式見解であるわけではありません。また、本ブログには、外部サイトにアクセスするリンクが含まれる場合があります。それらリンク先の内容について、New Relic がいかなる保証も提供することはありません。


