New Relic のメトリクスに設けられたカーディナリティ制限は、この業界としては極めて穏やかです。パワフルかつスケーラブルなデータプラットフォームによって、New Relic は、アカウントごとに一日あたり数百万にも及ぶカーディナリティを持つデータを難なく処理することができます。
しかしながら、他のすべての SaaS プラットフォームと同様、システムを保護すると同時に、すべてのユーザーが高いパフォーマンスを得られるように、合理的な範囲で制限を課しています。取り込まれたデータのカーディナリティが 1 日あたりの上限に達すると、システムが時系列的な集計データの生成を停止するため、時系列チャートにギャップが生じる可能性が高くなります。
当社は本日、メトリクスのカーディナリティに関する問題の診断と解決を容易にすることで、データ上のギャップ発生を防ぐとともに、カーディナリティの細かな制御を支援する、新しいカーディナリティ管理 UI をリリースします。今回のブログでは、この新しい機能を使用して以下のような操作を行う方法について説明します。
- アカウント内の使用状況を可視化する。アカウントのカーディナリティの使用傾向と、上限に対する使用割合を視覚的に把握できます。
- メトリクス単位での内訳を確認する。どのメトリクスがカーディナリティの増減に大きな影響を与えているかを特定できます。
- 属性を表示および整理する。メトリクスの属性をさらに掘り下げて、カーディナリティが高い属性をプルーニング(削除)し、カーディナリティバジェットを削減します。
New RelicのUI内でカーディナリティを簡単に監視および管理できます。
New Relicにおけるカーディナリティの仕組み
オブザーバビリティの文脈においてカーディナリティは、データフィールド内の一意の値の数を指します。一般に、カーディナリティが高いほどトラブルシューティング、異常検出、予測分析に役立つ詳細なインサイトが得られます。メトリックに付与された不変の属性(ディメンションとも呼ばれます)は、非構造化データを構造化するうえで不可欠な要素です。通常、メトリクス内の属性の数が増えると、カーディナリティ要件が高くなります。
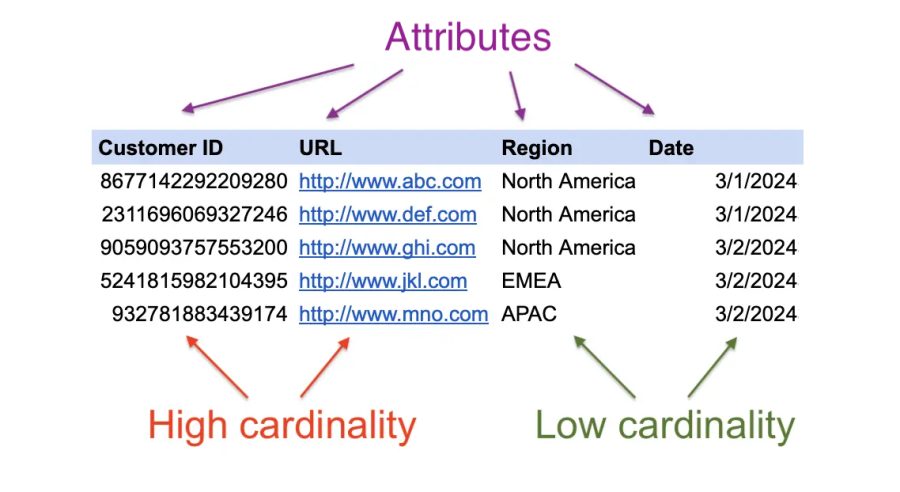
この大規模データセットのサンプルでは、各属性に含まれる一意の値の数を見ると、「顧客ID」および「URL」は「地域」および「日付」よりも指数関数的に多くなります。カーディナリティの詳細についてはこちらをご覧ください。
カーディナリティバジェット
前述の通り、カーディナリティが高いデータは、その分だけ詳細な情報が得られるため、複雑なシステムを理解するうえで有用ですが、同時にデータサイズの増加とクエリパフォーマンスの低下に繋がるデメリットも生じます。New Relic は各アカウントや各メトリックに対して、1 日あたりのカーディナリティ制限を設けていますが、このような制限は、データの極端な肥大化を抑制しパフォーマンスを確保しつつクエリの高速化に寄与するものとお考えください。
カーディナリティ制限が発生すると、次のような措置が取られます。
- New Relic は該当するアカウントに
NrIntegrationErrorを報告します。New Relic Query Language(NRQL)でクエリを実行すると、設定の不備や制限による、データの取り込みの問題を把握することができます。 - また、New Relic のデータ管理ハブの制限セクションにも表示されます。
- 制限に達しても、New Relic はすべてのデータの処理と保存を続行しますが、その日の残りの時間はロールアップ(集計)の作成を停止します。
通常、1 時間を超える期間のクエリ結果はロールアップされた結果が返されますが、そのようなクエリを実行した際に、データが保存されていないように見える場合があります。クエリ対象期間を短くすることで、送信された生データに対しては引き続きクエリを実行できますので、その点についてはご安心ください。
制限の詳細については、ドキュメントを参照してください。
カーディナリティを簡単に管理
カーディナリティの制御や問題の把握を容易にするために、新しいカーディナリティ管理メニューを追加しました。
従来、カーディナリティの問題を把握するには、New Relic の Data explorer や NRQL に関して広範な知識が必要でした。どのメトリクスのカーディナリティが高いかを調べ、さらにメトリクス内のどの属性が原因であるかを特定するためのクエリは複雑なものになります。
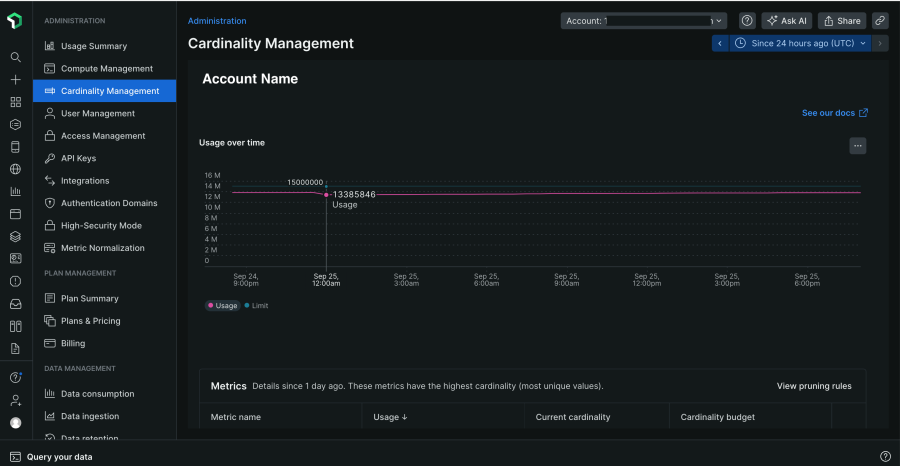
これが、数クリックの操作だけで把握できるようになりました。新しいカーディナリティ管理 UI にアクセスするには、New Relic UI の左下にある自分の名前をクリックし、[Administration] を選択し、[Cardinality Management] をクリックしてください。
この新しいカーディナリティ管理 UI を使用すると、次のことが可能です。
- アカウント内のバジェットとカーディナリティの使用傾向を確認できます。
- どのメトリクスがカーディナリティの増減に大きな影響を与えているかを特定できます。
- メトリクスの属性をさらに深く掘り下げて、カーディナリティが高い属性をプルーニング(削除)し、カーディナリティバジェットを削減することができます。
アカウントのカーディナリティの確認
メインのカーディナリティ管理 UI の上部には、アカウントに関連する情報が表示されます。New Relic のほとんどの機能と同様に、右上の隅にあるアカウントピッカーを選択すると、操作対象のアカウントを変更できます。
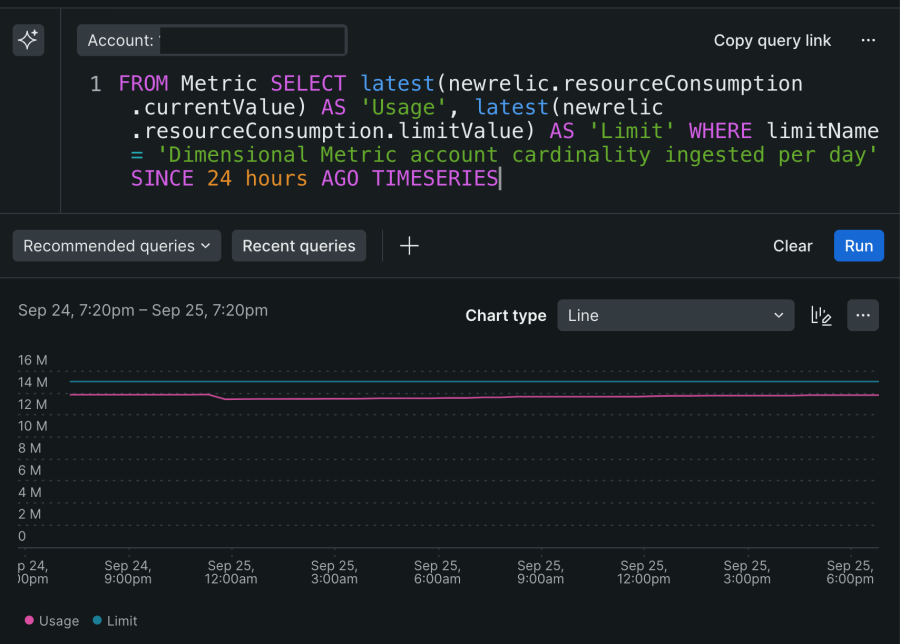
使用状況の時系列的変化
このページの最初のチャートには、アカウントに適用されている制限値と、現在のカーディナリティ使用状況が時系列チャートとして表示されます。ページ右上にあるタイムピッカーで表示期間を調整できます。
メトリクステーブル
下の Metrics テーブルでは、メトリクス名ごとのカーディナリティの内訳を確認できます。このテーブルには、アカウント内で最もカーディナリティが高いメトリクスの上位 20 件が表示されます。テーブルにはメトリクスごとに、次の詳細情報が含まれます。
- メトリクス名
- カーディナリティの使用率(上限に対する使用量の比率)
- 現在のカーディナリティの値
- 現在の制限値
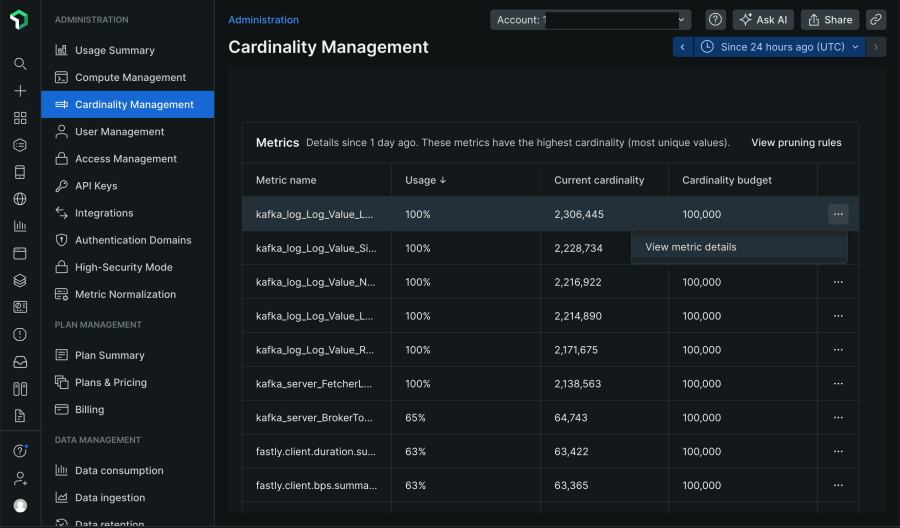
メトリクスごとのカーディナリティ使用状況を確認する
Metrics テーブル上で任意のメトリクス名をクリックすると、そのメトリクスのカーディナリティの内訳が詳細に表示されます。
メトリクス固有の使用状況
メトリクス固有のビューでは、現在のカーディナリティの使用状況(メトリクスごとのカーディナリティバジェット)とアカウント全体の使用状況(アカウント全体のカーディナリティバジェット)が 2 つのバーチャートとして表示されます。その下には、メトリクスのカーディナリティの使用状況と制限値を時系列的に示すグラフがあります。ここでも、画面右上のタイムピッカーを変更することで、データの表示対象期間を変更することが可能です。
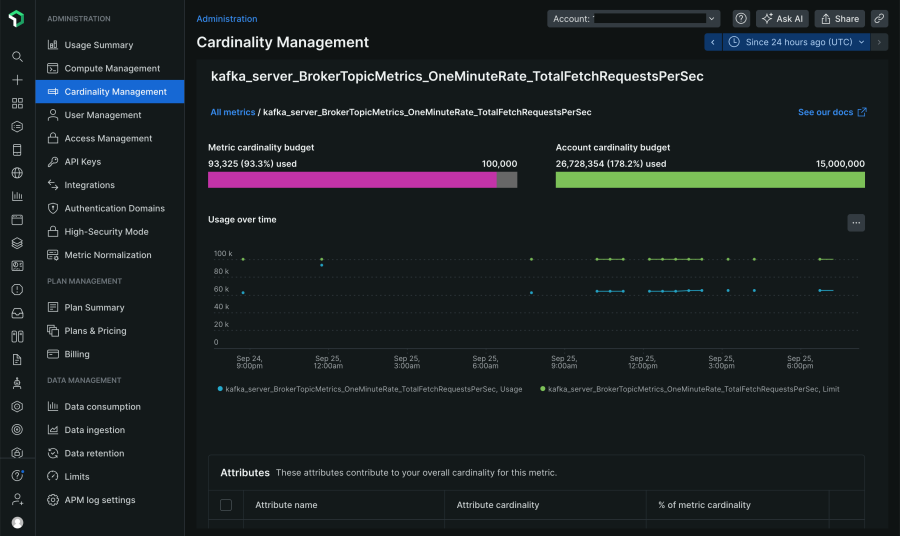
属性テーブル
時系列表示の下には、メトリクス内でカーディナリティに影響を与えている属性と、全体に対する割合が表示されます。これによって、カーディナリティの増加に最も大きな影響を与えている属性を簡単に特定することができます。

カーディナリティが高い属性のプルーニング
メトリック集計のプルーニング(整理)を使用すると、メトリクス集計から除外する属性を指定することができます。プルーニングは、コンテナ ID やその他の一意の識別子のような、カーディナリティの高い属性がメトリックに含まれる場合に適しています。これらの高カーディナリティ属性は、インシデント発生時のトラブルシューティングのように、短期的には重要な情報が含まれますが、時間の経過とともに価値が失われ、長期的な傾向を調べるときには不要となることもあります。
従来でも、NerdGraph を使用することで集計メトリックをプルーニングすることができましたが、今後は UI 上で簡単にプルーニング ルールを管理できます。
メトリックのプルーニングルールの表示、作成、削除
注:データのプルーニングと破棄の違い
- 属性またはメトリクスのプルーニング:選択したメトリクス、または特定の属性のロールアップの作成を停止することを指します。NRQL クエリの実行時に
RAWキーワードを使用すると、プルーニングされたデータではなく、生データに対してクエリすることができます。 - 破棄:該当するデータを New Relic データベースからデータを完全に排除することを指します。データ破棄の詳細については、こちらのドキュメントをご覧ください。
プルーニングルールの作成
メトリクスごとの使用状況を表示するページ上で、プルーニングする属性の横にあるチェックボックスを選択します。次に、Create pruning rule ボタンを選択し、ルール名を入力します。次の画面で、プルーニングによってカーディナリティがどのように変化するかを確認することができます。
プルーニングルールの表示と削除
カーディナリティ管理 UI の Metric テーブルで View Pruning Rules を選択すると、プルーニングルールが表示されます。ここで作成済みのプルーニングルールを削除することもできます。
次のステップ
新しいカーディナリティ管理メニューでは、メトリクスのカーディナリティに関する問題の診断、解決、管理を簡単に行えます。カーディナリティ管理 UI にアクセスして、ぜひお試しください。詳細については、こちらのドキュメントもご参照ください。
本ブログに掲載されている見解は著者に所属するものであり、必ずしも New Relic 株式会社の公式見解であるわけではありません。また、本ブログには、外部サイトにアクセスするリンクが含まれる場合があります。それらリンク先の内容について、New Relic がいかなる保証も提供することはありません。


