The American Academy of Pediatrics (AAP) recently completed our rebundling project: AAP sites with their own environments and URLs were migrated to the aap.org website. We did this for a couple of reasons, and as we moved over to an observability mindset to standardize our approaches with New Relic, one tool that stood out was workloads.
AAP is an organization of 67,000 pediatricians whose mission is “to attain optimal physical, mental, and social health and well-being for all infants, children, adolescents and young adults. To accomplish this, AAP shall support the professional needs of its members.
A bit of background on how we go to our rebundle: When we first spun up our online membership service offering, each service and site had its own operations and ways of working. As we grew and scaled, that distributed system became more complex to manage. Because of this complexity, we couldn’t see an overall view of customer experience. If there was an issue, engineers had to review multiple dashboards, look into app service logs, then line up that information, which often had different data points, to understand what was happening. This meant resolving issues could require creative, one-off solutions. It was hindering our growth. Thus we decided to bundle those services and ways of working under aap.org. This project highlighted the benefit of everybody working together and what can happen when we standardize processes. Now that teams are working together across the organization, we needed a common tool and language to encourage collaboration and ease of working.
Using workloads
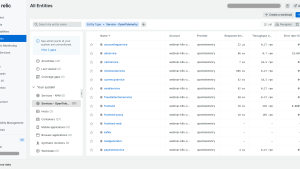
With more services and priority applications now under the one website, we are able to make use of New Relic features like workloads. Workloads lets us get all the data, from client-side applications and backend APIs, to the underlying infrastructure, to make sense of a large data set. With workloads, we can create an aggregated view of the health and activity of the entities for a specific business unit or team. Now teams can see everything that affects AAP at once. It's easier to support, it's easier to maintain.
To support team members on understanding observability metrics—alerts, dashboards and reporting—we introduced a train-the-trainer approach. Seven people are on rotational primary support. That's really when we want them to focus on understanding observability and how to leverage it to proactively detect issues. When a new person starts, we make sure that they shadow others that are doing the primary support and really get an idea of what to look at, where to dig deep in all the different areas. I think we have found the right balance between immersing people in the system, and spreading the support role across all the team so everyone has time for other tasks, as well as to see the impact of our infrastructure on our members and users.
In the past, we didn't have alerting procedures in place. Over the last three years, we've implemented alerts so that we immediately know when there's a problem. Now, when our support gets a call, it's not “Oh, what's going on here?” But instead “Yes, we know about this. We're really sorry. We're working through it.”
Setting up workloads
Introducing workloads was a big win for us: our support team knows that if one database is involved, they need to look at a particular server. So instead of looking at all 30 or 40 things that we have associated with the database, they narrow their focus on the most important things that tie the ecosystem of aap.org together. We started by creating a single workload dashboard view for all the components of our AAP.org website and our APIs. This also allowed us to put in place some threshold alerts, and over time, we have been able to desensitize these alerts so that they are truly informing us of the most pressing cases: at first alerts tend to be less granular, we got alerted to every slight change in our services, but as we received these alerts, we were able to use New Relic Query Language (NRQL) to finetune our alerts to only alert us to issues that truly existed and needed further investigation.
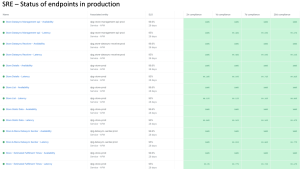
Our main workloads dashboard covers the aap.org website. When we're looking at, all the different areas and services are visible. It ties in with our e-commerce site. It ties in with our membership connection. We have all the web servers tied in, the different monitors, the different browsers associated with it.

From observing ‘blips’ to responding to incidents
When there is a blip, we'll see some of the workload monitors turn from green to orange or we'll see it turn to red for just a minute. It could be because a bot is hitting our site, it is obvious from the short duration and the traffic spikes when that happens. For greater challenges, where monitors stay red, we look to the error logs. Error logs help us compare what is happening to a baseline and compare with a percentage of how long the incident has been occurring: was this somebody transferring a large file during that time? We can instantly click and narrow it all the way down to the core procedure.
With our order tracking service for example, we have certain thresholds, and we know if there are issues throughout the day because we can see the load speed. We could see spikes throughout the day, but only for a small period of time. So there are blips throughout the day, which we're okay with as long they do not cross our threshold. If that’s the case, it would indicate a problem and we'd highlight that to narrow down and see what was going on during that time.
Other issues we have addressed include seeing that our web servers were not getting traffic evenly distributed by the load balancer. We made a change to the load balancer to distribute by
thread instead of round robin, which immediately helped avoid a single web server getting overtaxed. It's a good example of the sorts of issues that our workloads identify that allow us to tweak our infrastructure in some way to address and improve performance.
Database calls or specific stored procedures that are running abnormally and need updates or performance tuning done to them is another common example of the sorts of issues we address. These are not key performance challenges that impact on our infrastructure overall, but each issue affects our user experience and by knowing exactly where the problem is occurring, we can adjust settings or improve configurations to make it easier for our members and customers when they visit our site.
Tracking deployments
We also track feature deployments. We recently had an incident where, after a feature deployment, other services were getting affected and we had a huge degradation of performance across the site. Using workloads, we were able to narrow down the logs and the event viewer and identified a configuration change on the deployment. We were able to implement a fix soon after. It was a huge win to see that work in action. Without workloads, that would have taken a much longer recovery time: we would have had to check a lot more area, log in to a lot of servers, and really figure out what was happening by looking at the totality of everything whereas now everything's in one place and we can focus instantly.
Synthetic monitoring is also part of our deployment lifecycle. We use scripted API, ping, and simple browser monitors to monitor specific performance metrics and integration points within applications. We actively use these alerts in production environments to monitor our services and their availability. These monitors ensure the reliability and performance of our applications with advanced alerting.
Communicating what’s happening
While our engineering and support teams focus on monitoring our workloads, we do work to communicate what is happening across the organization: we regularly inform scrum teams and product managers about issues. We share some data with upper management—we might highlight the blips we see and how we address them. Our customer service team is also informed, so that if they get calls from members, e-commerce customers, or others, they can let people know we are addressing the issue.
Since working on our rebundling and on our workloads views, we haven’t had issues that require whole-organization decisions around the need to invest in additional infrastructure or wholesale change to what we are doing. We use New Relic to keep organizational teams in the loop: monthly and regularly reports highlight how we respond to challenges and maintain performance and a high user experience. This means that if down the road, we need a new resource allocation or changes to our IT systems, decision makers would be primed by being kept informed over the months.
Workloads has been a game changer for us. It provides the ability to preview the health of all our priority applications in one page and gives us the option to link dashboards to various metrics. In turn, this enabled us to use NRQL to fine tune our alert conditions and cut down on the noise from overly sensitive alerts. Workloads also gives us added granularity to error messaging and lets us recognize the source of issues and corrective actions or next steps with more ease and less effort.
If you’re a Nonprofit did you know that New Relic offers a Nonprofit program exclusively for Nonprofits, sign-up here now for free and get 1000GB of free data ingest every month and 3 free Data Plus users.
本ブログに掲載されている見解は著者に所属するものであり、必ずしも New Relic 株式会社の公式見解であるわけではありません。また、本ブログには、外部サイトにアクセスするリンクが含まれる場合があります。それらリンク先の内容について、New Relic がいかなる保証も提供することはありません。


